

Are Petroleum Prices Bottoming?
- May petroleum product futures expire quietly
- Refiners have lost U.S. crude oil production as feedstock
- OPEC+ production is set to fall 9.7 million barrels daily
- Natural gas rig count retreats to 2016 level


The Matrix
The May futures contracts for refined products expired in a quiet session on Thursday, April 30. The extravagant expiration of the May WTI crude oil saw the first negative WTI futures price ever. Contrary to expectations, however, vigorous action by the CME to reduce open interest in May petroleum products took the steam out of those markets.
Data from the last two months show an extraordinary contrast in price action. In the month of March, the front-month RBOB contract moved 61% lower from open to close, In April, the contract moved 23% higher from open to close.
ULSD futures prices displayed a different volatility dynamic. In March ULSD prices lost 31% from open to close. April added another decline of 26% from open to close.
Massive demand destruction altered the typical seasonal price pattern for RBOB futures. Gasoline futures tend to be in a strong rally phase in the March – May time period. Will seasonally bullish factors be able to reassert themselves?
And that’s the question now being asked by oil traders. Is the market bottoming? There is evidence to suggest that it may be.
Actions now underway are intended to slow (or will have the effect of slowing) the rate of global inventory accumulation. U.S. shale oil production has fallen with lower prices. EIA has projected a decline of more than one million barrels daily in shale output by the end of 2021.
The drop in U.S. production has occurred at a rapid pace. Domestic output was put at 13.1 million barrels daily on March 13. Most recently, production was estimated to be 12.1 million barrels per day (April 24, 2020).
The U.S. oil rig count has fallen nearly in half. According to the Baker Hughes weekly count, oil and gas rigs have fallen to 408, fewer than last year at this time when the count was 582 rigs higher. So large a reduction raises questions of whether a viable petroleum industry can operate on fewer rigs.
Overseas production is set to be cut as well. Supply cuts are scheduled to begin on May 1. OPEC, led by the Saudis along with Russia and other non-OPEC producers have committed to taking 9. 7 million barrels out of the market. It does not seem likely that this will be enough to mop up current supply excesses and Saudi Arabia is reported to be sending about 44 million barrels of crude oil to the United States in the next few weeks.
On balance, declining domestic production and OPEC+ cuts could be enough to slow the rate of supply builds in the United States. The rate of compliance with COVID-19 social distancing appears to be falling too, implying the need for more oil in the economy. These considerations support our view that higher price may be ahead.
Supply/Demand Balances
Supply/demand data in the United States for the week ending April 24, 2020, were released by the Energy Information Administration.
Total commercial stocks of petroleum rose by 10.4 million barrels during the week ending April 24, 2020.
Commercial crude oil supplies in the United States increased by 9.0 million barrels from the previous report week to 527.6 million barrels.
Crude oil inventory changes by PAD District:
PADD 1: Down 0.5 million barrels to 11.1 million barrels
PADD 2: Plus 3.4 million barrels to 155.6 million barrels
PADD 3: Plus 7.2 million barrels to 280.4 million barrels
PADD 4: Down 0.2 from the previous report week to 24.4 million barrels
PADD 5: Down 0.8 million barrels to 56.2 million barrels
Cushing, Oklahoma inventories were up 3.7 million barrels from the previous report week to 63.4 million barrels.
Domestic crude oil production was fell 0.1 million barrels per day from the previous report week to 12.1 million barrels daily.
Crude oil imports averaged 5.302 million barrels per day, a daily increase of 365,000 barrels. Exports rose 412,000 barrels daily to 3.302 million barrels per day.
Refineries used 69.6 percent of capacity, up 2.0% from the previous report week.
Crude oil inputs to refineries increased 305,000 barrels daily; there were 12.761 million barrels per day of crude oil run to facilities. Gross inputs, which include blending stocks, rose 382,000 barrels daily to reach 12.825 million barrels daily.
Total petroleum product inventories rose 1.4 million barrels from the previous report week.
Gasoline stocks decreased 3.7 million barrels daily from the previous report week; total stocks are 259.6 million barrels.
Demand for gasoline rose 549,000 barrels per day to 5.860 million barrels per day.
Total product demand increased 1.660 million barrels daily to 15.763 million barrels per day.
Distillate fuel oil stocks increased 5.1 million barrels from the previous report week; distillate stocks are at 142.0 million barrels. EIA reported national distillate demand at 3.164 million barrels per day during the report week, an increase of 36,000 barrels daily.
Propane stocks decreased 0.6 million barrels from the previous report week; propane stocks are 56.8 million barrels. The report estimated current demand at 1.315 million barrels per day, an increase of 372,000 barrels daily from the previous report week.
Natural Gas
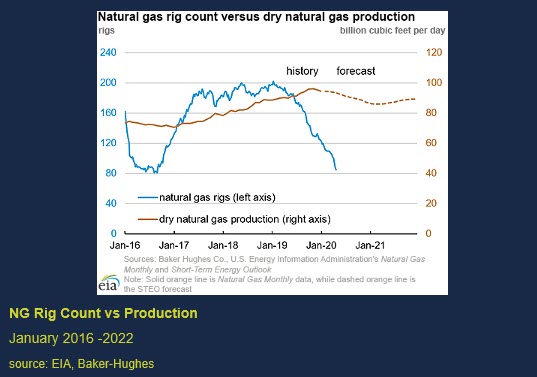
Prices for natural gas futures may be forming a bottom as well. Natural gas rigs in use on April 21 fell to 85 units. This level was last seen in August, 2016. The rig count reached a high of 202 units during January 2019, and has since been falling. This reflects fewer degree days and less associated natural gas as oil production has retreated from its highs.
According to EIA:
The net injections into [natural gas] storage totaled 70 Bcf for the week ending April 24, compared with the five-year (2015–19) average net injections of 74 Bcf and last year’s net injections of 114 Bcf during the same week. Working natural gas stocks totaled 2,210 Bcf, which is 360 Bcf more than the five-year average and 783 Bcf more than last year at this time.
Futures trading involves significant risk and is not suitable for everyone. Transactions in securities futures, commodity and index futures and options on future markets carry a high degree of risk. The amount of initial margin is small relative to the value of the futures contract, meaning that transactions are heavily “leveraged”. A relatively small market movement will have a proportionately larger impact on the funds you have deposited or will have to deposit: this may work against you as well as for you. You may sustain a total loss of initial margin funds and any additional funds deposited with the clearing firm to maintain your position. If the market moves against your position or margin levels are increased, you may be called upon to pay substantial additional funds on short notice to maintain your position. If you fail to comply with a request for additional funds within the time prescribed, your position may be liquidated at a loss and you will be liable for any resulting deficit. Past performance may not be indicative of future results. This is not an offer to invest in any investment program.
Powerhouse is a registered affiliate of Coquest, Inc.
Was this helpful? We’d like your feedback.
Please respond to [email protected]
Copyright© 2020 Powerhouse, All rights reserved.
