Oil Futures Break Higher
- ULSD price objective nears $2.00
- Investor sentiment high but softening
- Fewer heating degree days generated
Alan Levine—Chairman, Powerhouse
(202) 333-5380
The Matrix
Oil prices have broken higher after spending several weeks range trading. ULSD prices moved between $1.64 and $1.77 from mid-March until April 14, when the effect of shrinking inventories and optimistic demand expectations brought prices soaring to $1.8945. There has been no follow through since.
Crude oil and RBOB futures prices had similar patterns. Crude oil futures ranged between $57.30 and $61.50. RBOB traded between $1.87 and $2.03. These contracts have also broken resistance. The highs reached early in March could be the market’s next objectives: ULSD at $1.98, RBOB, $2.17, and WTI crude oil at $68.
The highly regarded technical system called “Elliott Wave” offers another way to evaluate price expectations. Elliott Wave does not rely on market fundamentals. It is a form of technical analysis that looks for recurrent long-term price patterns related to persistent changes in traders’ sentiment and psychology. Price projections are determined by mathematical relationships rather than factors such as supply and demand. Because of this, Elliott Wave theory offers a unique way to assess market action. Current Elliott Wave analysis supports the bull case.
A survey of sentiment by the American Association of Individual Investors (AAII) suggests that one-third of respondents saw the economy in a strong recovery based on growing COVID-19 vaccinations and returns to the workplace.
Some 25% were less optimistic. They attributed growth in the economy as assisted by stimulus checks and other financial support. The final third of respondents expressed concern that financial markets were fragile. AAII’s sentiment survey showed overall slippage in stock market expectations but still above 50%.
Housing starts are robust. They reportedly jumped 20% in March to 1.7 million units. There were 126,000 more units than expected, bouncing back from February’s disappointing drop of 11.3%. The gain was the largest since June 2006. Even with inflated costs of material such as lumber, buyers are enthusiastic. A backlog of starts could support the homebuilding trade.
Supply/Demand Balances
Supply/demand data in the United States for the week ended April 9, 2021, were released by the Energy Information Administration.
Total commercial stocks of petroleum fell by 9.1 million barrels.
Commercial crude oil supplies decreased by 5.9 million barrels from the previous report week to 492.4 million barrels.
Crude oil inventory changes by PAD District:
PADD 1: Down 0.2 to 8.1 million barrels
PADD 2: Plus 2.3 million barrels to 130.5 million barrels
PADD 3: Down 9.5 million barrels to 283.8 million barrels
PADD 4: Plus 0.5 million barrels to 23.8 million barrels
PADD 5: Down 2.0 million barrels to 46.2 million barrels
Cushing, Oklahoma, inventories were up 0.4 million barrels from the previous report week to 46.7 million barrels.
Domestic crude oil production was up 100,000 barrels daily from the previous report week to 11.0 million barrels daily.
Crude oil imports averaged 5.852 million barrels per day, a daily decrease of 411,000 barrels. Exports decreased 855,000 barrels daily to 2.579 million barrels per day.
Refineries used 85% of capacity, up 1.0% from the previous report week.
Crude oil inputs to refineries increased 7,000 barrels daily; there were 15.051 million barrels per day of crude oil run to facilities. Gross inputs, which include blending stocks, fell 26,000 barrels daily to 15.419 million barrels daily.
Total petroleum product inventories fell 8.0 million barrels from the previous report week.
Gasoline stocks rose 0.3 million barrels from the previous report week; total stocks are 234.9 million barrels.
Demand for gasoline rose 162,000 barrels per day to 8.944 million barrels per day.
Total product demand increased 1.092 million barrels daily to 20.328 million barrels per day.
Distillate fuel oil stocks fell 2.1 million barrels from the previous report week; distillate stocks are at 143.5 million barrels. EIA reported national distillate demand at 4.128 million barrels per day during the report week, an increase of 464,000 barrels daily.
Propane stocks rose 1.0 million barrels from the previous report week; propane stocks to 40.6 million barrels. The report estimated current demand at 1.112 million barrels per day, a decrease of 546,000 barrels daily from the previous report week.
Natural Gas
The nation generated 3,763 HDDs for the period July 1, 2020, to April 17, 2021. These were 358 fewer HDDs than normal. New England and the Mid-Atlantic states had about 625 fewer-than-HDDs for the period. Fewer HDDs help explain the small range of price for natural gas futures.
Spot natural gas futures have inched higher during April and are now trading around $2.68. That’s an 11-cent rally starting April 6. This challenges resistance, with next resistance at $2.75
According to the EIA:
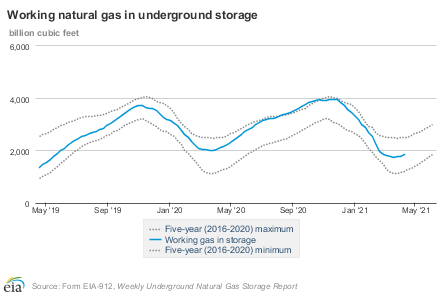
The net injections [of natural gas] into storage totaled 61 Bcf for the week ending April 9, compared with the five-year (2016–2021) average net injections of 26 Bcf and last year’s net injections of 68 Bcf during the same week. Working natural gas stocks totaled 1,845 Bcf, which is 11 Bcf more than the five-year average and 242 Bcf lower than last year at this time.
Was this helpful? We’d like your feedback.
Please respond to [email protected]
Powerhouse Futures & Trading Disclaimer
Copyright 2021 Powerhouse Brokerage, LLC, All rights reserved


