Oil Prices Resist U.S. Crude Stock Draw
- Large reduction in crude stocks offset by product gain
- Price charts signal resistance
- OPEC seeks 5-yr average stock level
- Natural gas demand rose 26% week on week

The Matrix
Oil prices continued to dance around the highs as 2018 opened. Factors that could push prices lower – in particular long speculative positions in crude oil – remain in place. Technical price charts are starting to signal tops as well.
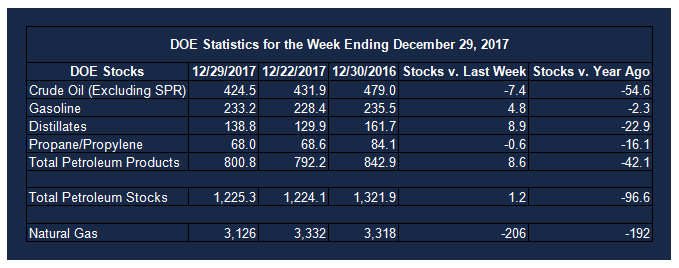
EIA’s U.S. Petroleum Balance Sheet for the week ending December 29, 2017, showed a large (7.4 million barrel) reduction in crude oil inventories. Gasoline and ULSD stocks more than offset the crude oil stock decline with gains of 4.8 and 8.9 million barrels respectively.
The net accumulation of petroleum supply for the report week put a damper on further price advances. Candlestick chart patterns conveyed ambivalence among traders about further advances. Other technical indicators also signal a pause in the advance.

Price Chart: Crude Futures, 90 Days
The unusual cold that enveloped the Northeast was not enough to move futures prices higher. ULSD was being taken for use in power generation where natural gas supply was insufficient but futures prices did not respond materially. Physical market supply concerns were expressed in cash prices, where basis for some important products expanded dramatically. ULSD prices on the Gulf Coast, for instance, showed a basis expansion of nearly eight cents as the week ended.
More broadly, OPEC continues to seek reduction of commercial inventories. The organization is relying on the five-year average stock level as its target, using data from the OECD as its single most important metric. OPEC believes that total stocks were around 137 million barrels higher than the average last October. Overall, OPEC believes that excess inventories have been roughly halved since May, 2017 through its efforts.
The OPEC constraint efforts may have contributed to WTI and Brent backwardation, a bullish sign for price. And global consumption has been rising too. Nonetheless, OPEC’s hopes are in competition with the reality of U.S. crude oil production. In its most recent balance sheet, EIA estimates output of 9.782 million barrels daily, rapidly closing in on ten million barrels per day.
Supply/Demand Balances
Supply/demand data in the United States for the week ending December 29, 2017 were released by the Energy Information Administration.
Total commercial stocks of petroleum rose 1.2 million barrels during the week ending December 29, 2017.
Builds were reported in stocks of gasoline, fuel ethanol, K-jet fuel, and distillates. Draws were reported in stocks of residual fuel oil, propane, and other oils.
Commercial crude oil supplies in the United States decreased to 424.5 million barrels, a draw of 7.4 million barrels.
Crude oil supplies decreased in four of the five PAD Districts. PAD District 1 (East Coast) crude oil stocks declined 1.7 million barrels, PADD 2 (Midwest) stocks fell 3.4 million barrels, PADD 3 (Gulf Coast) stocks retreated 2.0 million barrels, and PADD 4 (Rockies) stocks decreased 0.9 million barrels. PAD District 5 (West Coast) crude stocks increased 0.7 million barrels.
Cushing, Oklahoma inventories decreased 2.4 million barrels from the previous report week to 49.0 million barrels.
Domestic crude oil production increased 28,000 barrels daily to 9.782 million barrels per day from the previous report week.
Crude oil imports averaged 7.966 million barrels per day, a daily decrease of 27,000 barrels. Exports rose 265,000 barrels daily to 1.475 million barrels per day.
Refineries used 96.7 per cent of capacity, an increase of 1.0 percentage points from the previous report week.
Crude oil inputs to refineries increased 210,000 barrels daily; there were 17.608 million barrels per day of crude oil run to facilities. Gross inputs, which include blending stocks, rose 168,000 barrels daily to 17.883 million barrels daily.
Total petroleum product inventories saw an increase of 8.6 million barrels from the previous report week.
Gasoline stocks rose 4.8 million barrels from the previous report week; total stocks are 233.2 million barrels.
Demand for gasoline decreased 834,000 barrels per day to 8.650 million barrels daily.
Total product demand decreased 828,000 barrels daily to 19.947 million barrels per day.
Distillate fuel oil supply rose 8.9 million barrels from the previous report week to 138.8 million barrels. National distillate demand was reported at 3.588 million barrels per day during the report week. This was a weekly decrease of 739,000 barrels daily.
Propane stocks decreased 0.7 million barrels from the previous report week to 68.0 million barrels. Current demand is estimated at 1.691 million barrels per day, an increase of 158,000 barrels daily from the previous report week.
Natural Gas
According to the Energy Information Administration:
Withdrawals from working gas were more than double the five-year average. Net withdrawals from storage totaled 206 Bcf for the week ending December 29, compared with the five-year (2012–16) average net withdrawal of 99 Bcf and last year’s net withdrawals of 76 Bcf during the same week. Working gas stocks totaled 3,126 Bcf, which is 192 Bcf less than both the five-year average and last year at this time.
Falling temperatures result in increased withdrawals of natural gas from storage. Colder weather throughout the Lower 48 states during the storage week resulted in increased consumption of natural gas. Substantial increases in natural gas consumption in the power, industrial, and residential/commercial sectors during this storage week resulted in withdrawals from storage in every region of the Lower 48 states. Storage withdrawals exceeded the five-year average rate in each of the storage regions.
Total U.S. consumption of natural gas rose by 26% compared with the previous report week, as cold temperatures affected much of the country. Total U.S. consumption reached an all-time high on January 1, according to data from PointLogic Energy. Natural gas consumed for power generation climbed by 18% week over week. Industrial sector consumption increased by 8% week over week. In the residential and commercial sectors, consumption increased by 39%. Natural gas exports to Mexico decreased 5%.
Futures trading involves significant risk and is not suitable for everyone. Transactions in securities futures, commodity and index futures and options on future markets carry a high degree of risk. The amount of initial margin is small relative to the value of the futures contract, meaning that transactions are heavily “leveraged”. A relatively small market movement will have a proportionately larger impact on the funds you have deposited or will have to deposit: this may work against you as well as for you. You may sustain a total loss of initial margin funds and any additional funds deposited with the clearing firm to maintain your position. If the market moves against your position or margin levels are increased, you may be called upon to pay substantial additional funds on short notice to maintain your position. If you fail to comply with a request for additional funds within the time prescribed, your position may be liquidated at a loss and you will be liable for any resulting deficit. Past performance may not be indicative of future results. This is not an offer to invest in any investment program.
Powerhouse is a registered affiliate of Coquest, Inc.
Was this helpful? We’d like your feedback.
Please respond to [email protected]
Copyright © 2018 Powerhouse, All rights reserved.