Dramatic Shifts in Global Crude Oil Distribution
- OPEC losing clout
- Russia finds new markets
- U.S. asserts energy independence
- Natural gas seeks status as a destination fuel.
Sincerely,
Alan Levine, Chairman
Powerhouse
(202) 333-5380

The Matrix
Global oil market dynamics are shifting. Punishment imposed on Russia by the European Union has not been effective in reducing that nation’s exports. Russia has successfully moved much of its petroleum exports east to China and India. Thus far in 2023, China reportedly has taken 20% of Russian crude oil exports; India’s take amounts to 10%.
Middle East producers now face competition for traditional buyers from Russia. OPEC still provides 55% of India’s crude oil; this share is down from previous years.
OPEC has had much the same experience with the United States. The chart of U.S. imports from OPEC shows our reduced reliance on the cartel for our supply. In 2008 and 2009, America took nearly six million barrels daily of OPEC oil. Last year we took only 1.25 million barrels from the group.
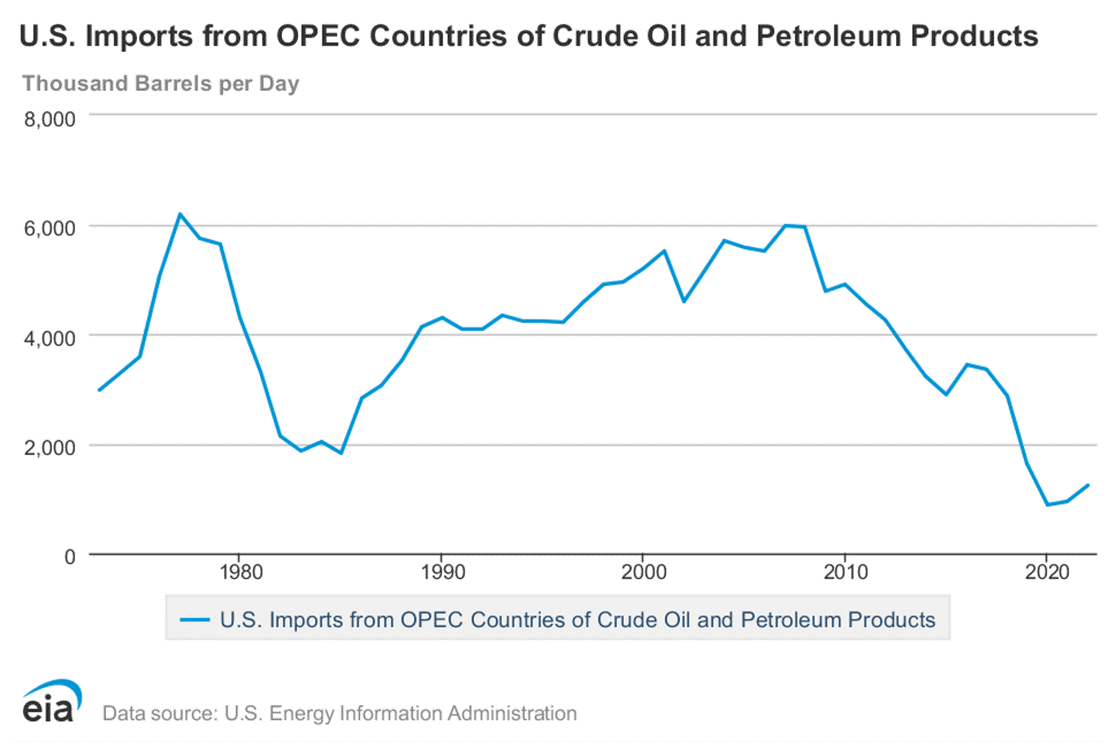
Crude oil from Persian Gulf OPEC came to 740 thousand barrels daily in 2022. In 2004, the Gulf provided 2.4 million barrels daily to the U.S., a 70% decline. The nexus of crude oil movements in recent years has heightened Russia’s position as a global supplier.
Gasoline lost nearly six million barrels of inventory over the past four weeks.

Supplies had been hugging the bottom of the five-year minimum since last May, and have plunged even lower this year. Part of the continuing low level of supply reflects dramatic expansion of gasoline exports. They moved above 1.2 million barrels daily last December. Gasoline consumption has moved over nine million barrels daily.
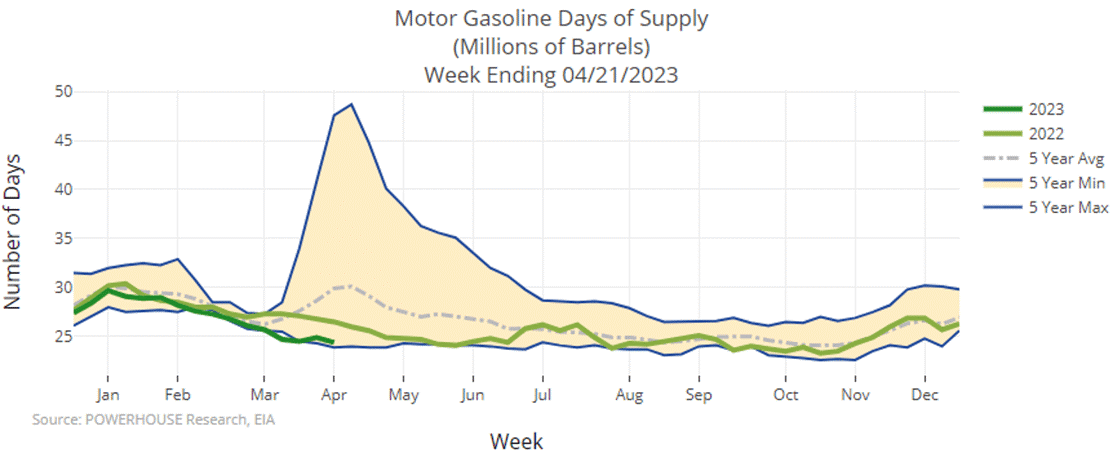
These actions have held days of supply of gasoline to a minimum since February.
Broader economic concerns now emerging could explain the bearish condition of petroleum liquids prices. This week’s calendar includes a meeting of the Federal Reserve. Many observers expect further increase in interest rates in response to continuing inflation. This could inhibit economic growth and demand for oils.
Supply/Demand Balances
Supply/demand data in the United States for the week ended April 21, 2023 were released by the Energy Information Administration.
Total commercial stocks of petroleum fell (⬇) 0.4 million barrels to 1.234 billion barrels during the week ended April 21, 2023.
Commercial crude oil supplies in the United States were lower (⬇) by 5.1 million barrels from the previous report week to 460.9 million barrels.
Crude oil inventory changes by PAD District:
PADD 1: Unchanged (=) at 7.6 million barrels
PADD 2: Down (⬇) .7 million barrels to 117.9 million barrels
PADD 3: Down (⬇) 5.4 million barrels to 259.9 million barrels
PADD 4: Up (⬆) 0.2 million barrels to 25.2 million barrels
PADD 5: Up (⬆) 0.9 million barrels to 50.3 million barrels
Cushing, Oklahoma, inventories were up (⬆) 0.3 million barrels from the previous report week to 33.1 million barrels.
Domestic crude oil production was down (⬇) 100,000 barrels at 12.2 million barrels daily.
Crude oil imports averaged 6.376 million barrels per day, a daily increase (⬆) of 81,000 barrels. Exports increased (⬆) 248,000 barrels daily to 4.819 million barrels per day.
Refineries used 91.3% of capacity; 0.2 percentage points higher (⬆) than the previous report week.
Crude oil inputs to refineries decreased (⬇) 11,000 barrels daily; there were 15.833 million barrels per day of crude oil run to facilities. Gross inputs, which include blending stocks, rose (⬆) 43,000 barrels daily to 16.483 million barrels daily.
Total petroleum product inventories rose (⬆) by 4.7 million barrels from the previous report week, falling to 772.9 million barrels.
Total product demand increased (⬆) 891,000 barrels daily to 20.208 million barrels per day.
Gasoline stocks decreased (⬇) 2.4 million barrels from the previous report week; total stocks are 221.1 million barrels.
Demand for gasoline increase (⬆) 992,000 barrels per day to 9.511 million barrels per day.
Distillate fuel oil stocks decreased (⬇) 0.6 million barrels from the previous report week; distillate stocks are at 111.5 million barrels. EIA reported national distillate demand at 3.728 million barrels per day during the report week, an decreased (⬇) of 37,000 barrels daily.
Propane stocks increase (⬆) by 3.4 million barrels from the previous report week to 58.9 million barrels. The report estimated current demand at 676,000 barrels per day, a decrease (⬇) of 193,000 barrels daily from the previous report week.
Natural gas
The long-term viability of the natural gas sector has been boosted by advances in technology, as demonstrated by the expansion of LNG production and growth in American exports. Demand is emerging in manufacturing and transportation domestically.
Natural gas is seeking to be a “destination fuel,” a permanent part of America’s low- to no-carbon energy supply, rather than a transition fuel to be ultimately supplanted by renewables. If a permanent place for natural gas is to be carved out, certain conditions should be met.
- Develop technology to create enough supply of carbon-neutral/carbon-negative natural gas to satisfy all of its ongoing, long-term uses. A net zero carbon emitter should find ready acceptance in a clean climate economy
- Zero-carbon natural gas technology will have to be able to compete financially with renewable energy.
- Zero-carbon natural gas growth might be limited by constraints on the electrical grid. And with improvements in electrical storage and the grid infrastructure itself, natural gas could become a true destination fuel.
Natural gas spot futures ended April on an uptick. The gain was not however, enough to break resistance, settling at $2.41, basis June. Bearish market features abound. It is the midst of the spring shoulder season, a no-man’s land of indecision. Weather features have been few, especially degree days. The week ended April 20 recorded very few cooling degree days. Nationally, there were only two CDDs more than normal created. Heating Degree Days fell short too. The report week saw 73 HDDs generated overall, 13 HDDs fewer than normal and 35 fewer than last year at this time.
According to the EIA:
Net [natural gas] injections into storage totaled 79 Bcf for the week ended April 21, compared with the five-year (2018–2022) average net injections of 43 Bcf and last year’s net injections of 42 Bcf during the same week. Working natural gas stocks totaled 2,009 Bcf, which is 365 Bcf (22%) more than the five-year average and 525 Bcf (35%) more than last year at this time.
Was this helpful? We’d like your feedback.
Please respond to [email protected]
Powerhouse Futures & Trading Disclaimer
Copyright 2023 Powerhouse Brokerage, LLC, All rights reserved