Price Spike Offers Opportunity for Hedgers
- OPEC+ limiting output
- Fracking allows major new U.S. production
- Hedgers take advantage of price rally
- Natural gas storage could reach 3.6 Bcf as injection season ends

The Matrix
Pricing in today’s energy markets reflects the importance of two relatively new factors. The Saudis have led OPEC and several related countries (the “plus” in OPEC+) to a new spirit of cooperation. OPEC+ appears to be producing less in support of higher prices. How different from the time when Saudi Arabia bore the load of supply constraint while fellow OPEC members largely ignored limits imposed on them by the group.
Technology has made the difference in United States crude oil supply. Production of crude oil and natural gas from shale formations has vaulted the country into first place among global producers of oil and gas.
OPEC’s Challenge: The U.S. Is Now the World’s Largest Producer of Crude Oil Crude Oil Production (US, Russia, Saudi Arabia) 2010 – 2019
source: The Paris-based IEA
In the early years of the 21st century, U.S. production of crude oil fell below six million barrels daily (while imports approached 14 million barrels daily.) Application of fracturing technology has since reversed those sources of crude oil. Most recently, domestic production has hovered around mid-12 million barrels daily while overseas supplies have fallen dramatically. EIA has reported June 2019 crude oil imports at seven million barrels daily. (Canada alone provided 3.8 million barrels per day.)
Effective energy independence for the United States was put to a test with the attack on Saudi Arabian crude oil processing. The strike took out about 5 percent of global supplies. Prices spiked on the NYMEX commodities exchange. WTI futures reached $63 following the attack. By the weeks end, WTI futures had fallen to $59.
The strike occurred on the weekend. There was no follow on. If there had been one, the price rally might have continued. In its absence, the retracement of prices was perhaps, not surprising. This demonstrated the importance of U.S. crude oil in establishing a global stability not available when OPEC controlled so much of the world’s crude oil supply.
One other feature of the spike in prices may have come as producers used the opportunity to hedge production. This could have locked in prices substantially higher for 2020. Markets gave hedgers the opportunity to lock in 2020 hedges at $55 and fixed prices for 2021 around $52.
Supply/Demand Balances
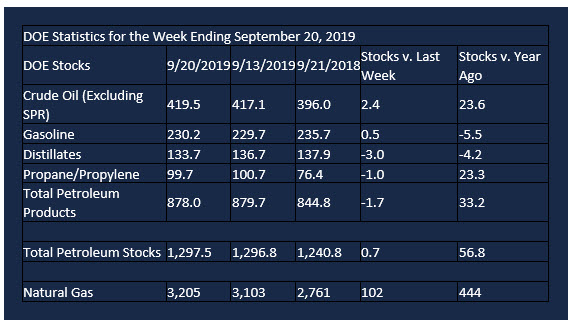
Supply/demand data in the United States for the week ending September 20, 2019, were released by the Energy Information Administration.
Total commercial stocks of petroleum rose by 0.7 million barrels during the week ending Sept. 20, 2019.
Commercial crude oil supplies in the United States increased 2.4 million barrels from the previous report week to 419.5 million barrels.
Crude oil inventory changes by PAD District:
PADD 1: Plus 0.4 million barrels to 11.2 million barrels
PADD 2: Plus 2.9 million barrels to 125.3 million barrels
PADD 3: Minus 3.4 million barrels to 216.5 million barrels
PADD 4: Plus 0.8 million barrels to 20.4 million barrels
PADD 5: Plus 1.5 million barrels to 46.1 million barrels
Cushing, Oklahoma inventories rose 2.2 million barrels from the previous report week to 40.9 million barrels.
Domestic crude oil production was rose 100,000 daily from the previous report week to 12.5 million barrels per day.
Crude oil imports averaged 6.378 million barrels per day, a daily decrease of 672,000 barrels. Exports fell 192,000 barrels daily to 2.983 million barrels per day.
Refineries used 89.8 percent of capacity, down 1.4% from the previous report week.
Crude oil inputs to refineries decreased 194,000 barrels daily; there were 16.513 million barrels per day of crude oil run to facilities. Gross inputs, which include blending stocks, fell 257,000 barrels daily to reach 16.888 million barrels daily.
Total petroleum product inventories fell 1.7 million barrels from the previous report week.
Gasoline stocks increased 0.5 million barrels daily from the previous report week; total stocks are 230.2 million barrels.
Demand for gasoline rose 407,000 barrels per day to 9.346 million barrels per day.
Total product demand increased 919,000 barrels daily to 21.181 million barrels per day.
Distillate fuel oil stocks decreased 3.0 million barrels from the previous report week; distillate stocks are at 133.7 million barrels. EIA reported national distillate demand at 3.897 million barrels per day during the report week, an increase of 38,000 barrels daily.
Propane stocks decreased 1.0 million barrels from the previous report week; propane stocks are 99.7 million barrels. The report estimated current demand at 1.457 barrels per day, an increase of 743,000 barrels daily from the previous report week.
Natural Gas
According to the Energy Information Administration:
Net injections into storage totaled 102 Bcf for the week ending September 20, compared with the five-year (2014–18) average net injections of 74 Bcf and last year’s net injections of 51 Bcf during the same week. Working gas stocks totaled 3,205 Bcf, which is 47 Bcf lower than the five-year average and 444 Bcf more than last year at this time.
The average rate of net injections into storage is 28% higher than the five-year average so far in the refill season (April through October). If the rate of injections into storage matched the five-year average of 10.7 Bcf/d for the remainder of the refill season, total inventories would be 3,645 Bcf on October 31, which is 47 Bcf lower than the five-year average of 3,692 Bcf for that time of year.
Futures trading involves significant risk and is not suitable for everyone. Transactions in securities futures, commodity and index futures and options on future markets carry a high degree of risk. The amount of initial margin is small relative to the value of the futures contract, meaning that transactions are heavily “leveraged”. A relatively small market movement will have a proportionately larger impact on the funds you have deposited or will have to deposit: this may work against you as well as for you. You may sustain a total loss of initial margin funds and any additional funds deposited with the clearing firm to maintain your position. If the market moves against your position or margin levels are increased, you may be called upon to pay substantial additional funds on short notice to maintain your position. If you fail to comply with a request for additional funds within the time prescribed, your position may be liquidated at a loss and you will be liable for any resulting deficit. Past performance may not be indicative of future results. This is not an offer to invest in any investment program.
Powerhouse is a registered affiliate of Coquest, Inc.
Was this helpful? We’d like your feedback.
Please respond to [email protected]
Copyright© 2019 Powerhouse, All rights reserved.