Oil Price Range-Bound, Contrary to Fundamentals
- Crude oil trading between $51 and $58
- Crude oil fundamentals are bearish
- ULSD fundamentals are bullish
- Natural gas rally stalls at resistance


The Matrix
Prices for energy futures contracts continue in range-bound trading. The attack on Saudi Arabian production facilities created price spikes. ULSD futures ran to $2.0966, and WTI crude oil hit $63.38. Prices have since settled into tight ranges.
Crude oil has been trading between $51 and $58 since late September, not yet signaling a trend. Underlying physical crude oil data are weighted heavily toward the bear side. The oil supply/demand balance for the week ending November 1, 2019, reported an increase in crude oil stocks of 7.9 million barrels per day. Net crude oil imports increased 300,000 barrels daily, and crude oil run to stills declined 237,000 barrels per day. U.S. production of crude oil stayed at 12.6 million barrels daily for the fifth consecutive week.
ULSD futures prices are range-bound, too, varying between $1.83 and $1.99. ULSD physical data, on the other hand, show more bullish tendencies. DOE’s supply/demand balance showed a decline in inventories. Supply fell 300,000 barrels per day during the report week. Lower stocks add to the tightness Powerhouse has observed before. It also shows in the eroding Days Supply position, now at only 28 days.
Flat prices in light of bearish crude oil fundamentals and bullish ULSD appear to be counter-intuitive. One analysis suggests that continuing stock market strength is the final factor in explaining price support. In this view, strength in the S&P 500 supports the oil price. A failure in equity markets should be mirrored in oil prices. Even an attack on Saudi Arabian facilities has not been enough to support prices. Backwardation in crude oil prices could reduce the effect of downward price pressure but would not eliminate lower prices.
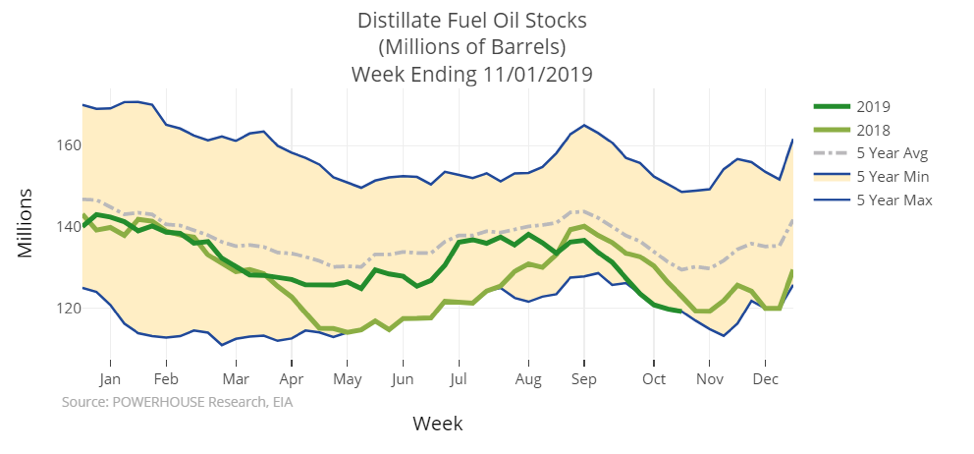
Distillate Stocks – 5-Year 2015 -2019 source: EIA, POWERHOUSE
Supply/Demand Balances
Supply/demand data in the United States for the week ending Nov. 1, 2019, were released by the Energy Information Administration.
Total commercial stocks of petroleum rose by 3.9 million barrels during the week ending Nov. 1, 2019.
Commercial crude oil supplies in the United States increased by 7.9 million barrels from the previous report week to 446.8 million barrels.
Crude oil inventory changes by PAD District:
PADD 1: Fell 0.4 million barrels to 10.5 million barrels
PADD 2: Plus 3.1 million barrels to 134.6 million barrels
PADD 3: Plus 2.8 million barrels to 227.6 million barrels
PADD 4: Plus 0.2 million barrels to 22.8 million barrels
PADD 5: Plus 2.2 million barrels to 51.2 million barrels
Cushing, Oklahoma inventories rose 1.7 million barrels from the previous report week to 47.7 million barrels.
Domestic crude oil production was unchanged from the previous week at 12.6 million barrels per day.
Crude oil imports averaged 6.077 million barrels per day, a daily decrease of 620,000 barrels. Exports fell 956,000 barrels daily to 2.371 million barrels per day.
Refineries used 86.0 percent of capacity, down 1.7% from the previous report week.
Crude oil inputs to refineries decreased 237,000 barrels daily; there were 15.761 million barrels per day of crude oil run to facilities. Gross inputs, which include blending stocks, fell 318,000 barrels daily to reach 16.169 million barrels daily.
Total petroleum product inventories fell 4.0 million barrels from the previous report week.
Gasoline stocks decreased 2.8 million barrels daily from the previous report week; total stocks are 217.2 million barrels.
Demand for gasoline fell 639,000 barrels per day to 9.145 million barrels per day.
Total product demand decreased 463,000 barrels daily to 21.134 million barrels per day.
Distillate fuel oil stocks decreased 0.6 million barrels from the previous report week; distillate stocks are at 119.1 million barrels. EIA reported national distillate demand at 4.296 million barrels per day during the report week, an increase of 33,000 barrels daily.
Propane stocks increased 0.3 million barrels from the previous report week; propane stocks are 100.2 million barrels. The report estimated current demand at 1.107 barrels per day, an increase of 106,000 barrels daily from the previous report week.
Natural Gas
Buy the rumor, sell the fact. Expectations of colder weather initiated a seventy cent rally in natural gas prices. Moderating weather stalled the advance. The current price, around $2.65, could fall to support around $2.00 because of continuing production strength.
The decline in natural gas prices formed a chart pattern called an “island top reversal.” Powerhouse anticipated this reversal in a note last Thursday to clients, Technical Analysis Update: Natural Gas Futures Reversal?
The update observed, “The market then stalls and eventually a bearish price gap occurs reversing most, if not all, of the previous advance in price. In effect, bullish traders feel trapped on an ‘island’ of high prices.” To receive a copy of the full Powerhouse report, click here
According to the Energy Information Administration:
Net injections into storage totaled 34 Bcf for the week ending November 1, compared with the five-year (2014–18) average net injections of 57 Bcf and last year’s net injections of 63 Bcf during the same week. Working gas stocks totaled 3,729 Bcf, which is 29 Bcf more than the five-year average and 530 Bcf more than last year at this time.
Futures trading involves significant risk and is not suitable for everyone. Transactions in securities futures, commodity and index futures and options on future markets carry a high degree of risk. The amount of initial margin is small relative to the value of the futures contract, meaning that transactions are heavily “leveraged”. A relatively small market movement will have a proportionately larger impact on the funds you have deposited or will have to deposit: this may work against you as well as for you. You may sustain a total loss of initial margin funds and any additional funds deposited with the clearing firm to maintain your position. If the market moves against your position or margin levels are increased, you may be called upon to pay substantial additional funds on short notice to maintain your position. If you fail to comply with a request for additional funds within the time prescribed, your position may be liquidated at a loss and you will be liable for any resulting deficit. Past performance may not be indicative of future results. This is not an offer to invest in any investment program.
Powerhouse is a registered affiliate of Coquest, Inc.
Was this helpful? We’d like your feedback.
Please respond to [email protected]
Copyright© 2019 Powerhouse, All rights reserved.