

Petroleum Product Futures Break Out
- ULSD price well-timed for fall rally
- Demand growth put inventories under stress
- Economic stimulation likely in China
- Heat boosts CDDs in the West.
Sincerely,
Alan Levine, Chairman
Powerhouse
(202) 333-5380
The Matrix
Petroleum product futures prices advanced for the fifth consecutive time last week. A spate of bullish information brought ULSD and RBOB to higher weekly settlements; both were breakouts above resistance.
The advance in ULSD prices was seasonally important, coming at a time when such prices have historically taken off after a period of indecisive trading, moving higher from now until October.
Markets reacted bullishly to a variety of considerations.
- Domestic crude oil production fell 100,000 barrels daily
- Growth in demand stressed supply, rising more than 500,000 barrels during the report week ended July 21.
- Refiners reduced crude oil inputs to facilities
- Inventories fell for crude oil, motor gasoline, and ULSD. There was a net loss of total supply of one-half million barrels daily.
Broader economic data were mostly bullish too. China’s emergence from pandemic conditions was not as robust as expected in the second quarter. The government is likely to establish stimulative measures, which could contribute to higher prices for crude oil.
At the same time, falling inventory levels here in the Untied States and a further cut of one million barrels daily by Saudi Arabia are in play.
Prices for petroleum products have moved higher without relief. Technical measures for both diesel and gasoline are showing overbought signals. While some technically based profit-taking could occur, as long as fundamentals remain this bullish, higher prices are likely ahead.
Resistance for spot ULSD futures stands at $3.00. a further target at $3.58 could be seen. Gasoline’s rally has been muted by comparison. Gasoline prices are coming out of season, except that there are six weeks before the Atlantic hurricane season peaks. Coastal damage has been limited, but as reported here, meteorologists have factored El Nino into the weather models, increasing storm probabilities.
Those readers with exposure to price impacts of a storm can protect themselves with the purchase of calls or of call spreads for the autumn ahead.
Supply/Demand Balances
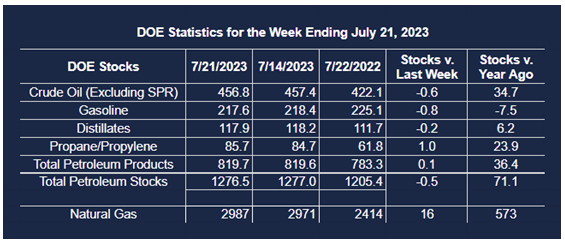
Supply/demand data in the United States for the week ended July 21, 2023, were released by the Energy Information Administration.
Total commercial stocks of petroleum fell (⬇) 0.5 million barrels to 1.2765 billion barrels during the week ended July 21, 2023.
Commercial crude oil supplies in the United States were lower (⬇) by 0.6 million barrels from the previous report week to 456.8 million barrels.
Crude oil inventory changes by PAD District:
PADD 1: Up (⬆) 0.2 million barrels to 8.1 million barrels
PADD 2: Down (⬇) 3.1 million barrels to 119.0 million barrels
PADD 3: Up (⬆) 2.6 million barrels to 259.0 million barrels
PADD 4: Down (⬇) 0.6 million barrels to 24.2 million barrels
PADD 5: Up (⬆) 0.4 million barrels to 46.6 million barrels
Cushing, Oklahoma, inventories were down (⬇) 2.9 million barrels from the previous report week to 38.3 million barrels.
Domestic crude oil production was lower by (⬇) 100,000 barrels from the previous report week to 12.2 million barrels daily.
Crude oil imports averaged 6.367 million barrels per day, a daily decrease (⬇) of 807,000 barrels. Exports increased (⬆) 777,000 barrels daily to 4.591 million barrels per day.
Refineries used 93.4% of capacity; 0.9 percentage points lower (⬇) than the previous report week.
Crude oil inputs to refineries decreased (⬇) 107,000 barrels daily; there were 16.478 million barrels per day of crude oil run to facilities. Gross inputs, which include blending stocks, decreased (⬇) 160,000 barrels daily to 17.068 million barrels daily.
Total petroleum product inventories increased (⬆) by 0.1 million barrels from the previous report week, down to 819.7 million barrels.
Total product demand increased (⬆) 509,000 barrels daily to 21.276 million barrels per day.
Gasoline stocks decreased (⬇) 0.8 million barrels from the previous report week; total stocks are 217.6 million barrels.
Demand for gasoline increased (⬆) 84,000 barrels per day to 8.939 million barrels per day.
Distillate fuel oil stocks decreased (⬇) 0.2 million barrels from the previous report week; distillate stocks are at 117.9 million barrels. EIA reported national distillate demand at 3.718 million barrels per day during the report week, an increase (⬆) of 49,000 barrels daily.
Propane stocks increased (⬆) by 1.0 million barrels from the previous report week to 85.7 million barrels. The report estimated current demand at 834,000 barrels per day, a decrease (⬇) of 83,000 barrels daily from the previous report week.
Natural Gas
Natural gas futures could not get off the schneid last week. Record heat and high Cooling Degree Days have not been enough to move prices out of a 33-cent range in effect for the past five weeks. Prices have ranged between $2.45 and $2.78 since the week beginning June 26, and show little evidence of breaking out.
The Climate Prediction Center’s summary of CDDs has reported some notable data.1 High CDDs overwhelmed the Western United States for the week ended July 22. The Pacific region generated 79 CDDs, 35 more CDDs than normal. The West South Central and Mountain regions were about 26 CDDs above normal.
Comparable data since the beginning of 2023 were impressive too. The West South Central region has produced 169 more CDDs than normal. And in New England, heat has produced 77 CDDs more than normal this year.
Futures prices have failed to reflect these results in recent weeks. As noted here, last winter’s relative warmth left the nation with more inventory than usual at the end of the withdrawal period. This occurred in Europe as well.
At the same time, European response to the invasion of Ukraine was still being felt. Its effect on supply from Russia accelerated the EU search for alternatives. The EU loaded its tanks, relying heavily on the United States for LNG. Gas storage across Europe was 84% full as of July 23, well above the 5-year seasonal average of 69% full for this time of year.
Other factors influenced market action. EIA’s Natural Gas Weekly Update for the week ended July 26, reported an increase in total U.S. natural gas supply. The country added 0.4 Bcf/d to supply, almost all of it through production of dry gas. Total demand for domestic natural gas fell for the week.
1 Heating and Cooling Degree Days
Degree days are based on the assumption that when the outside temperature is 65°F, we don’t need heating or cooling to be comfortable. Degree days are the difference between the daily temperature mean, (high temperature plus low temperature divided by two) and 65°F. If the temperature mean is above 65°F, we subtract 65 from the mean and the result is Cooling Degree Days. If the temperature mean is below 65°F, we subtract the mean from 65 and the result is Heating Degree Days.
According to the EIA:
- Net injections into storage totaled 16 Bcf for the week ended July 21, compared with the five-year (2018–2022) average net injections of 31 Bcf and last year’s net injections of 18 Bcf during the same week. Working natural gas stocks totaled 2,987 Bcf, which is 345 Bcf (13%) more than the five-year average and 573 Bcf (24%) more than last year at this time.
- According to The Desk survey of natural gas analysts, estimates of the weekly net change to working natural gas stocks ranged from net injections of 6 Bcf to 31 Bcf, with a median estimate of 14 Bcf.
- The average rate of injections into storage is 4% higher than the five-year average so far in the refill season (April through October). If the rate of injections into storage matched the five-year average of 9.3 Bcf/d for the remainder of the refill season, the total inventory would be 3,940 Bcf on October 31, which is 345 Bcf higher than the five-year average of 3,595 Bcf for that time of year.
Was this helpful? We’d like your feedback.
Please respond to [email protected]
Powerhouse Futures & Trading Disclaimer
Copyright 2023 Powerhouse Brokerage, LLC, All rights reserved


