U.S./OPEC Supply Tensions Mount
- U.S. production making unprecedented advance
- U.S.’s global market share is growing
- Saudi Arabia sets sights on a $60 oil price
- Coldest winter since Polar Vortex projected

The Matrix
The tension between the oil industry in the United States and OPEC continues to challenge analysts. Russia’s emergence as a player in possible global supplier configurations has only added to the complexity of the supply question.
Oil demand has become a longer term factor for energy market participants, as noted in a recent Weekly Energy Market Situation. Changes in demand are being led by changes in technology. Regulation with respect to emissions is playing a role as well.
The production situation in the United States has become an overarching issue for the global industry. Oil production has been making unprecedented advances. The country is well on its way toward overshadowing both Saudi Arabia and Russia. The U.S. market share is growing at the expense of those countries, introducing new concerns for national budgets and even their position as opinion and thought leaders in the global economy.
The recently concluded OPEC/Non-OPEC production agreement could have resolved the market share issue except as U.S. output rises irrespective of any OPEC arrangement. The cuts envisioned by the agreement are to sustain current cuts through 2018. (There is an option to review everything in June.)
Saudi Arabia has set some targets to determine its continued participation in the deal. The Kingdom is about to put shares of Aramco out to the market in an initial public offering. It seeks a $60 price as standard for the trade. Russia wants the same price to prevail in view of national elections in March 2018. Ironically, some Russian officials are concerned that such a price could boost the ruble and undercut Russia’s broader economy.
The United States is, of course, not part of any price control scheme. Moreover, data from the futures markets suggest that producers may have taken advantage of currently higher crude oil process to hedge their output. This would render them indifferent to market prices to the extent that they will have, in effect sold their production at a fixed price.
Supply/Demand Balances
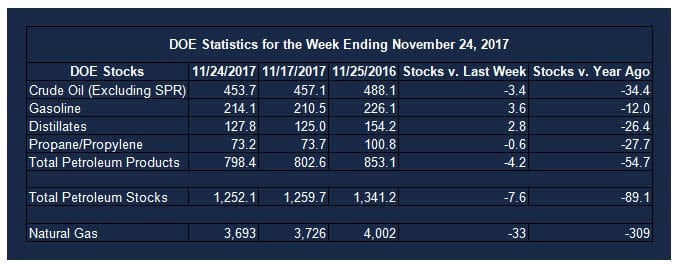
Supply/demand data in the United States for the week ending November 24, 2017 were released by the Energy Information Administration.
Total commercial stocks of petroleum fell 7.6 million barrels during the week ending November 24, 2017.
Builds were reported in stocks of gasoline, fuel ethanol, and distillates. Draws were reported in stocks of residual fuel oil, propane, and other oils. Stocks of K-jet fuel were unchanged from the previous report week.
Commercial crude oil supplies in the United States decreased to 453.7 million barrels, a draw of 3.4 million barrels.
Crude oil supplies decreased in three of the five PAD Districts. PAD District 1 (East Coast) crude oil stocks fell 1.5 million barrels, PADD 2 (Midwest) stocks declined 4 million barrels, PADD 3 (Gulf Coast) stocks retreated 0.2 million barrels. PAD District 4 (Rockies) stocks increased 0.7 million barrels and PADD 5 (West Coast) stocks increased 1.5 million barrels.
Cushing, Oklahoma inventories decreased 2.9 million barrels from the previous report week to 58.3 million barrels.
Domestic crude oil production increased 24,000 barrels daily to 9.682 million barrels per day from the previous report week.
Crude oil imports averaged 7.329 million barrels per day, a daily decrease of 544,000 barrels. Exports fell 179,000 barrels daily to 1.412 million barrels per day.
Refineries used 92.6 per cent of capacity, an increase of 1.3 percentage points from the previous report week.
Crude oil inputs to refineries increased 165,000 barrels daily; there were 17.003 million barrels per day of crude oil run to facilities. Gross inputs, which include blending stocks, rose 229,000 barrels daily to 17.191 million barrels daily.
Total petroleum product inventories saw a decrease of 4.2 million barrels from the previous report week.
Gasoline stocks rose 3.6 million barrels from the previous report week; total stocks are 214.1 million barrels.
Demand for gasoline decreased 871,000 barrels per day to 8.724 million barrels daily.
Total product demand increased 375,000 barrels daily to 19.664 million barrels per day.
Distillate fuel oil supply rose 2.7 million barrels from the previous report week to 127.8 million barrels. National distillate demand was reported at 3.882 million barrels per day during the report week. This was a weekly decrease of 175,000 barrels daily.
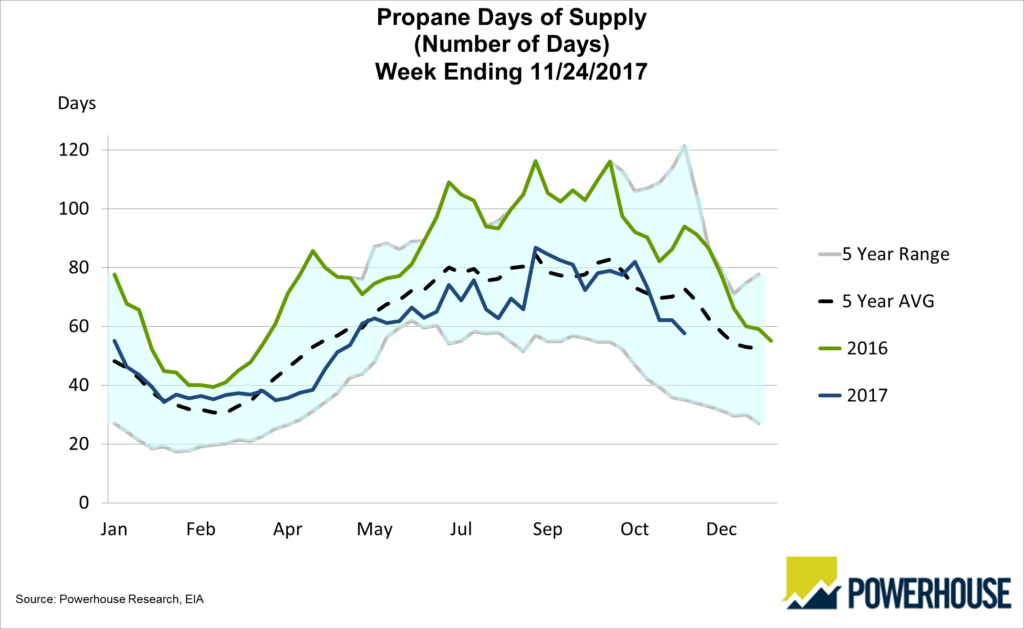
Propane stocks decreased 0.6 million barrels from the previous report week to 73.2 million barrels. Current demand is estimated at 1.107 million barrels per day, a decrease of 12,000 barrels daily from the previous report week.
Natural Gas
According to the Energy Information Administration:
Net withdrawals from storage totaled 33 Bcf for the week ending November 24, compared with the five-year (2012–16) average net withdrawal of 47 Bcf and last year’s net withdrawals of 43 Bcf during the same week. Relatively milder temperatures resulted in decreased natural gas consumption, primarily in the residential/commercial and electric power sectors, and the smaller-than-average net withdrawals. Working gas stocks ended the week with 3,693 Bcf, which is 107 Bcf lower than the five-year average and 309 Bcf lower than last year at this time.
Natural gas prices have shown wide variability in recent days. Variability suggests indecision in the market. Small wonder. Conflicting expectations for supply have rendered the market highly indecisive. Weather remains a major uncertainly. The coldest winter since the Polar Vortex has been projected for this winter, with December through February potentially exceeding last year for those months by 380 more degree days. In terms of natural gas supply, U.S. production is up significantly, 5.6 Bcf/d in 2017. If this production rate continues through 2018, and is not met by domestic and export demand, an oversupply situation could quickly develop.
Futures trading involves significant risk and is not suitable for everyone. Transactions in securities futures, commodity and index futures and options on future markets carry a high degree of risk. The amount of initial margin is small relative to the value of the futures contract, meaning that transactions are heavily “leveraged”. A relatively small market movement will have a proportionately larger impact on the funds you have deposited or will have to deposit: this may work against you as well as for you. You may sustain a total loss of initial margin funds and any additional funds deposited with the clearing firm to maintain your position. If the market moves against your position or margin levels are increased, you may be called upon to pay substantial additional funds on short notice to maintain your position. If you fail to comply with a request for additional funds within the time prescribed, your position may be liquidated at a loss and you will be liable for any resulting deficit. Past performance may not be indicative of future results. This is not an offer to invest in any investment program.
Powerhouse is a registered affiliate of Coquest, Inc.
Was this helpful? We’d like your feedback.
Please respond to [email protected]
Copyright © 2017 Powerhouse, All rights reserved