Election results offer oil markets mixed messages
- Crude oil put buying a bearish indicator
- Covid stimulus package likely to be smaller
- Softer attitude toward Iran now possible
- Natural gas storage declining
Alan Levine—Chairman, Powerhouse
(202) 333-5380

The Matrix
Traders always look for that special signal or indicator that will tip-off the market’s next move. Strong interest in crude oil puts is such an indicator.
On the day following this year’s election, the volume of put options on December WTI –financial instruments that increase in value as prices fall— exceeded 20,000 contracts. This reflected a bearish price outlook.
Powerhouse’s Weekly Energy Market Situation (September 20, 2020) noted that traders expected higher market volatility following the election. We suggested adding put protection at that time. And put buying followed that pattern on Wednesday as put buyers moved.
The results of these elections have not matched expectations. A Democratic sweep did not develop. Heightened resistance from the GOP could create opposition to several things on the Biden agenda. These include higher corporate taxes and expanded regulation on business.
The effect of a Biden win on oil and gas was expected to be bullish but traders now are looking at resistance. The likelihood of massive intervention by government on a Covid-19 relief package and on an infrastructure bill should be seen in less bullish oil prices. Bearish components of the Biden agenda, a turn toward renewable fuels and getting Iran back into the global supply mix must now be part of the equation.
In all of this political thinking the implications of the continuing impact of Covid-19 should not be ignored. Renewed lockdowns are being implemented in Europe with bearish implications for demand.
The introduction of new leadership in the United States will inevitably lead to a new profile for petroleum. The mixed results of a Democratic President, uncertain Senate control and a weakened Democratic House of Representatives can be read as a desire for moderation in policy of all kinds.
Energy policy will conform as well. Even without Covid, the future will face challenges not quite like those most of us expected in a Biden era.
Supply/Demand Balances
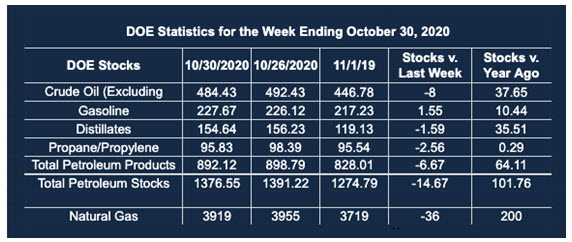
Supply/demand data in the United States for the week ended Oct. 30, 2020, were released by the Energy Information Administration.
Total commercial stocks of petroleum fell by 14.7 million barrels during the week ending Oct. 30, 2020.
Commercial crude oil supplies in the United States decreased by 8.0 million barrels from the previous report week to 484.4 million barrels.
Crude oil inventory changes by PAD District:
PADD 1: Down 0.3 million barrels to 10.4 million barrels
PADD 2: Plus 0.6 million barrels to 146.6 million barrels
PADD 3: Down 7.8 million barrels to 253.4 million barrels
PADD 4: Down 0.1 million barrels to 22.9 million barrels
PADD 5: Down 0.4 million barrels to 51.4 million barrels
Cushing, Oklahoma inventories were up 0.9 million barrels from the previous report week to 60.9 million barrels.
Domestic crude oil production fell 600,000 barrels per day to 10.5 million barrels daily.
Crude oil imports averaged 5.029 million barrels per day, a daily decrease of 634,000 barrels. Exports decreased 1,195,000 barrels daily to 2.265 million barrels per day.
Refineries used 74.6% of capacity, up 1.7% from the previous report week.
Crude oil inputs to refineries increased 164,000 barrels daily; there were 13.552 million barrels per day of crude oil run to facilities. Gross inputs, which include blending stocks, rose 129,000 barrels daily to reach 14.019 million barrels daily.
Total petroleum product inventories fell 6.7 million barrels from the previous report week.
Gasoline stocks increased 1.5 million barrels daily from the previous report week; total stocks are 227.7 million barrels.
Demand for gasoline fell 209,000 barrels per day to 8.336 million barrels per day.
Total product demand decreased 1.270 million barrels daily to 18.362 million barrels per day.
Distillate fuel oil stocks decreased 1.6 million barrels from the previous report week; distillate stocks are at 154.6 million barrels. EIA reported national distillate demand at 3.762 million barrels per day during the report week, a decrease of 478,000 barrels daily.
Propane stocks decreased 2.6 million barrels from the previous report week; propane stocks are 95.8 million barrels. The report estimated current demand at 1.248 million barrels per day, an increase of 128,000 barrels daily from the previous report week
Natural Gas
A strong rally in natural gas prices stalled last week. Spot futures reached $3.396 on Friday, November 2. This was the highest price seen since the beginning of 2019. Prices have subsequently fallen below $2.90 as warmer weather has cut into demand. Data from EIA nonetheless showed declining storage and expectations of falling production suggesting the recent price drop may be more a correction than a reversal of trend with more upside to go.
According to the EIA:
The net [natural gas] withdrawals from storage totaled 36 Bcf for the week ending October 30, compared with the five-year (2015–19) average net injections of 52 Bcf and last year’s net injections of 49 Bcf during the same week. Working natural gas stocks totaled 3,919 Bcf, which is 201 Bcf more than the five-year average and 200 Bcf more than last year at this time.
Was this helpful? We’d like your feedback.
Please respond to [email protected]
Powerhouse Futures & Trading Disclaimer
Copyright 2020 Powerhouse Brokerage, LLC, All rights reserved


