Bullish Features Still in Control
- New 2019 highs for oil futures
- OPEC/U.S. exports fall in latest reports
- Aramco Ghawar field shows reduced productive capacity
- Natural gas futures threatening support at $2.60

The Matrix
Gains in U.S. crude oil production have not blunted the bullish tone of the markets. On Friday, April 5, the principal oil contracts all settled at new highs for 2019. Both ULSD and RBOB contracts showed more power than did crude oil, expanding crack spreads. The market’s strength derived from reported OPEC production cuts, renewed tension in Libya and a bullish domestic employment report. Brent crude oil posted a newsworthy $70 level but over the course of the week, WTI added nearly $3 to value and Brent added around $2.
Strength also derived from news of OPEC exports in March. The group’s seaborne crude oil outflows were 23.04 million barrels per day. This was a 3 per cent drop from February and 4 per cent year-on-year. This overall drop came in spite of gains in Iran and Libya. Importantly, Saudi Arabia, Kuwait and Iraq had a decline of 21 per cent month-on-month.
U.S. exports fell too. They reportedly declined more than one million barrels daily, week-on-week. This may reflect distortions in Gulf Coast activity because of operational issues in the Houston Ship Channel.
In addition to these immediate bullish considerations, longer-term strength is likely to reflect an unusual development. Saudi Aramco has released details of company operations in connection with a bond sale in international markets. Perhaps the most powerful fact to emerge in the release is that Ghawar, the biggest Saudi oil field, can produce a maximum of 3.8 million barrels per day. This puts the lie to the long standing belief that the field could produce more than 5 million barrels daily – an article of faith in the petroleum analytic community.
Of course, the development of fracturing shale for tight oil is still growing, offsetting the now lower availability of Saudi oil as a predictable source of supply.
It also establishes the U.S. Permian basin as the largest global producer. This is consistent with Powerhouse’s observation that the geopolitics of oil are shifting dramatically in favor of a North American center. The Saudi Aramco bond prospectus lists numerous risks potentially threatening Saudi supply. These include missile attacks on Aramco facilities, proposed anti-trust laws on OPEC, actions taken against climate change and even abandonment of the U.S. dollar as the peg for oil prices.
Supply/Demand Balances
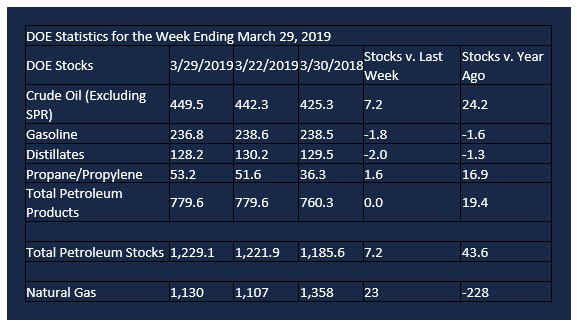
Supply/demand data in the United States for the week ending March 29, 2019 were released by the Energy Information Administration.
Total commercial stocks of petroleum increased 7.2 million barrels during the week ending March 29, 2019.
There were draws in stocks of gasoline, fuel ethanol, K-jet fuel, distillates, and residual fuel. There were builds in stocks of propane and other oils.
Commercial crude oil supplies in the United States increased 7.2 million barrels from the previous report week to 449.5 million barrels.
Crude oil supplies increased in three of the five PAD Districts. PADD 2 (Midwest) stocks grew 0.1 million barrels, PADD 3 (Gulf Coast) stocks rose 8.1 million barrels, and PADD 4 (Rockies) stocks rose 0.5 million barrels. PADD 1 (East Coast) stocks declined 0.7 million barrels and PADD 5 (West Coast) stocks fell 1.5 million barrels.
Cushing, Oklahoma inventories increased 0.2 million barrels from the previous report week to 47.1 million barrels.
Domestic crude oil production was rose 100,000 barrels per day from the previous report week to 12.2 million barrels per day.
Crude oil imports averaged 6.763 million barrels per day, a daily increase of 223,000 barrels. Exports decreased 163,000 barrels daily to 2.723 million barrels per day.
Refineries used 86.4 per cent of capacity, a decrease of 0.2 percentage points from the previous report week.
Crude oil inputs to refineries increased 18,000 barrels daily; there were 15.849 million barrels per day of crude oil run to facilities. Gross inputs, which include blending stocks, fell 36,000 barrels daily to 16.078 million barrels daily.
Total petroleum product inventories were unchanged from the previous report week.
Gasoline stocks decreased 1.8 million barrels daily from the previous report week; total stocks are 236.8 million barrels.
Demand for gasoline increased 7,000 barrels per day to 9.131 million barrels per day.
Total product demand decreased 132,000 barrels daily to 19.998 million barrels per day.
Distillate fuel oil stocks decreased 2.0 barrels from the previous report week; distillate stocks are at 128.2 million barrels. National distillate demand was reported at 4.156 million barrels per day during the report week. This was a weekly decrease of 60,000 barrels daily.
Propane stocks increased 1.6 million barrels from the previous report week; propane stock are 53.2 million barrels. Current demand is estimated at 848,000 barrels per day, a decrease of 156,000 barrels daily from the previous report week.
Natural Gas
According to the Energy Information Administration:
Net injections into storage totaled 23 Bcf for the week ending March 29, compared with the five-year (2014–18) average net withdrawals of 23 Bcf and last year’s net withdrawals of 34 Bcf during the same week. Working gas stocks totaled 1,130 Bcf, which is 505 Bcf lower than the five-year average and 228 Bcf lower than last year at this time.
Natural gas futures prices are still trading around $2.65. The technical picture does not favor the bullish side. Natural gas prices typically have a rally into late May or early June. This is not occurring and traders should be aware of support at $2.60.
Futures trading involves significant risk and is not suitable for everyone. Transactions in securities futures, commodity and index futures and options on future markets carry a high degree of risk. The amount of initial margin is small relative to the value of the futures contract, meaning that transactions are heavily “leveraged”. A relatively small market movement will have a proportionately larger impact on the funds you have deposited or will have to deposit: this may work against you as well as for you. You may sustain a total loss of initial margin funds and any additional funds deposited with the clearing firm to maintain your position. If the market moves against your position or margin levels are increased, you may be called upon to pay substantial additional funds on short notice to maintain your position. If you fail to comply with a request for additional funds within the time prescribed, your position may be liquidated at a loss and you will be liable for any resulting deficit. Past performance may not be indicative of future results. This is not an offer to invest in any investment program.
Powerhouse is a registered affiliate of Coquest, Inc.
Was this memo helpful? We’d like your feedback.
Please respond to [email protected]
Copyright© 2019 Powerhouse, All rights reserved.