American Crude Oil Production Offers an Alternative to OPEC
- Domestic crude oil supply closes in on pre-pandemic high
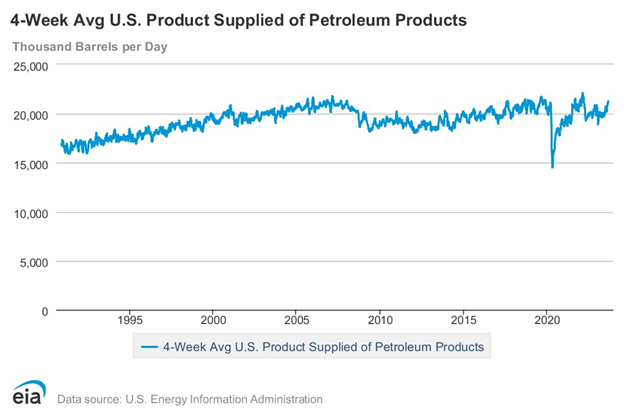
- Demand for petroleum products is growing rapidly
- U.S. offsets much of OPEC cuts
- Economics and climate could be at odds this winter in gas pricing.
Sincerely,
Alan Levine, Chairman
Powerhouse
(202) 333-5380
The Matrix
Production of crude oil in the United States stood at 12.8 million barrels daily for the week ended August 25, 2023. In early 2020, before the pandemic decimated demand, U.S. domestic production reached a high of 13 million barrels per day. With these most recent numbers, domestic production is well within reach of reclaiming that level.

Domestic demand reached 21.4 million barrels daily during the report week. This is moving close to the February 2022 record of 21.9 million daily barrels of consumption.
Ordinarily, domestic crude oil production is simply supplemented by imports to provide feedstock for U.S. refineries. But net imports have been on a downtrend recently. Cumulatively in 2023, the United States has imported 2.4 million net barrels daily. Last year, our net imports were 3.1 million barrels per day at this time.
The growth in domestic production takes on added significance in light of this shift in crude oil flows. Foreign markets have become so attractive (or strategically important in the case of the European Union) that exports have burgeoned in importance. Thus far, the country has exported 4.1 million barrels dally in 2023. Last year, comparable crude oil exports were 3.3 million barrels per day. This is an increase of 24.2%.
Major shifts in sources of crude oil supply account for much of this change and their potential hazard to domestic markets. These shifts reflect, of course, the apparent success of OPEC+ in curtailing production. The group’s production has reportedly fallen by 2.7 million barrels per day since last September.
And this comes at a time when demand is on an upswing. Thus, the significance of improved domestic production has been amplified. One analysis suggests that OPEC+ output has been cut by about 6% of 2022 supply. Non-OPEC supply has replaced two-thirds of that loss. U.S. shale oil accounted for half of that replacement.
Supply/Demand Balances
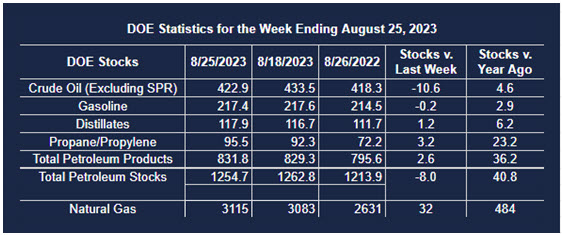
Supply/demand data in the United States for the week ended August 25, 2023, were released by the Energy Information Administration.
Total commercial stocks of petroleum fell (⬇) 8.0 million barrels to 1.2547 billion barrels during the week ended August 25, 2023.
Commercial crude oil supplies in the United States were lower (⬇) by 10.6 million barrels from the previous report week to 422.9 million barrels.
Crude oil inventory changes by PAD District:
PADD 1: Down (⬇) 0.3 million barrels to 6.7 million barrels
PADD 2: Down (⬇) 2.8 million barrels to 111.3 million barrels
PADD 3: Down (⬇) 9.2 million barrels to 234.3 million barrels
PADD 4: Unchanged (=) at 23.7 million barrels
PADD 5: Up (⬆) 1.7 million barrels to 46.9 million barrels
Cushing, Oklahoma, inventories were down (⬇) 1.5 million barrels from the previous report week to 29.2 million barrels.
Domestic crude oil production was unchanged (=) at 12.8 million barrels daily.
Crude oil imports averaged 6.617 million barrels per day, a daily decrease (⬇) of 316,000 barrels. Exports increased (⬆) 270,000 barrels daily to 4.528 million barrels per day.
Refineries used 93.3% of capacity; 1.2 percentage points lower (⬇) than the previous report week.
Crude oil inputs to refineries decreased (⬇) 173,000 barrels daily; there were 16.603 million barrels per day of crude oil run to facilities. Gross inputs, which include blending stocks, decreased (⬇) 217,000 barrels daily to 17.041 million barrels daily.
Total petroleum product inventories increased (⬆) by 2.5 million barrels from the previous report week, up to 831.8 million barrels.
Total product demand increased (⬆) 265,000 barrels daily to 21.429 million barrels per day.
Gasoline stocks decreased (⬇) 0.2 million barrels from the previous report week; total stocks are 217.4 million barrels.
Demand for gasoline increased (⬆) 157,000 barrels per day to 9.068 million barrels per day.
Distillate fuel oil stocks increased (⬆) 1.2 million barrels from the previous report week; distillate stocks are at 117.9 million barrels. EIA reported national distillate demand at 3.702 million barrels per day during the report week, a decrease (⬇) of 135,000 barrels daily.
Propane stocks increased (⬆) by 3.2 million barrels from the previous report week to 95.5 million barrels. The report estimated current demand at 639,000 barrels per day, a decrease (⬇) of 335,000 barrels daily from the previous report week.
Natural Gas
The rally in natural gas spot futures over the past two weeks brought prices to $2.865, adding forty-four cents to value. For some analysts, this appeared to be the beginning of a regular late summer rally in prices. It has not come to pass.
Several factors support the idea of a rally. Weather has been featured in the news. Regional storms, the massive hurricane Idalia, and intense heat, especially in the southwest, could have constricted supply or heightened demand. Data from the Weekly Natural Gas Report of EIA, showed higher weekly natural gas production and only a modest decline in national demand.
Generation of cooling degree days (CDDs) has been especially notable. In August, the West South-Central states, including Texas were hot enough to produce 664 CDDs. These were 137 CDDs more than normal and 111 more than last August. For all of 2023, the South-Central states have already experienced 331 more CDDs than normal.
The Pacific states include both California and Arizona. This region stood second in the nation for producing CDDs. August production of CDDs was 46 more than normal.
But even these massive invasions of heat have not been enough to ignite a rally. Power generation, where the impact of heavy CDDs would be felt, rose only 0.1% for the week ended August 30, 2023.
At the same time, injections into underground storage were 32 Bcf for the period ended August 25. This put working natural gas stocks 249 Bcf (9%) more than the five-year average at this time. Net injections have trailed the five-year average for eight consecutive weeks. During the week ended March 30, 2023, working stocks were 21% greater than the average of the previous five years.
The declining surplus comes at a time when economic trends and climatology may be at odds. Job creation is slowing. Weather expectations are pointing colder for the winter.
Meteorologists are anticipating a third consecutive La Nina winter. Typically, this means colder weather in the north and west. Moreover, there could be a stronger polar vortex bottling up cold air in the north. These factors could be the genesis of our next rally, coming perhaps later than usual.
According to the EIA:
- Net injections into storage totaled 32 Bcf for the week ended August 25, compared with the five-year (2018–2022) average net injections of 51 Bcf and last year’s net injections of 61 Bcf during the same week. Working natural gas stocks totaled 3,115 Bcf, which is 249 Bcf (9%) more than the five-year average and 484 Bcf (18%) more than last year at this time. Net injections have trailed the five-year average for eight consecutive weeks.
- The average rate of injections into storage is 4% lower than the five-year average so far in the refill season (April through October). If the rate of injections into storage matched the five-year average of 10.9 Bcf/d for the remainder of the refill season, the total inventory would be 3,844 Bcf on October 31, which is 249 Bcf higher than the five-year average of 3,595 Bcf for that time of year.
Was this helpful? We’d like your feedback.
Please respond to [email protected]
Powerhouse Futures & Trading Disclaimer
Copyright 2023 Powerhouse Brokerage, LLC, All rights reserved