Oil Price Turning Bearish?
- Refinery utilization set to fall
- Natural gas stocks could end injection season at 3.2 Tcf.
- Distillate fuel oil stocks replenishing
- Gasoline stocks plentiful


The Matrix
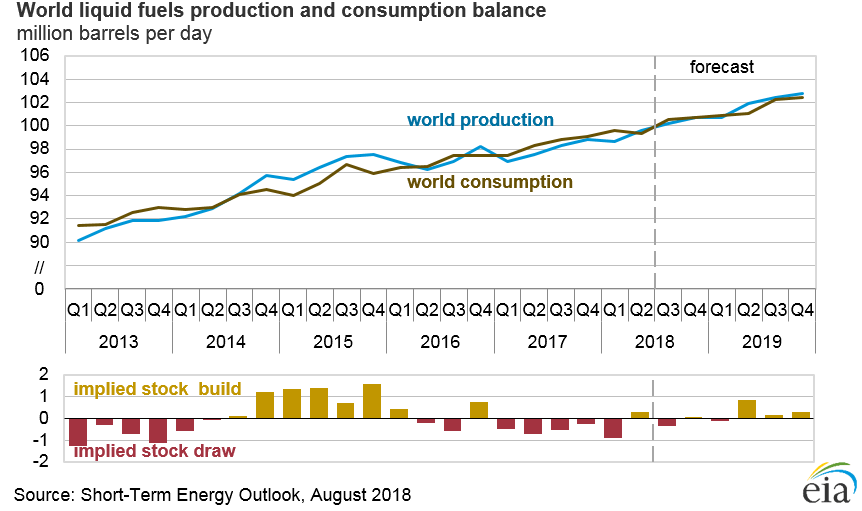
The global supply/demand picture is often, –even frequently — uncertain. As recently as the middle of May, domestic crude oil stocks were around 438 million barrels. By September 14, stocks fell to 394 million barrels. This was a ten per cent decline in availability, part of a larger drop in crude oil supply dating from 534 million barrels, reached in March, 2017. Overall, the United States has disposed of 140 million crude oil barrels, nearly 24 per cent of the nation’s commercial crude oil supply.
Some of the reduction went to refined products. In particular, distillate fuel oil inventories have filled out what seemed to be heading towards a serious shortfall. Last May, distillate fuel oil stocks were around 114 million barrels. This was lower than the five-year low. It contributed to a bullish outlook, along with concerns about improved global demand and tightening crude oil supply.
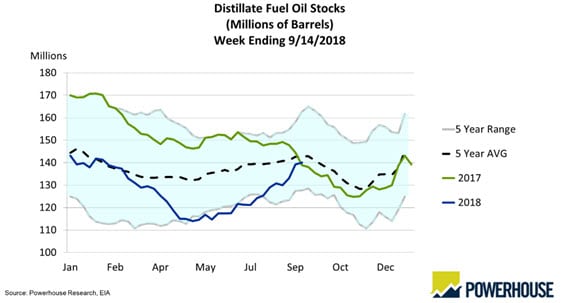
Distillate Stocks 2013-2018 Source: EIA, Powerhouse
EIA’s most recent Petroleum Balance Sheet put distillate fuel oil stocks at 140 million barrels, a 23 per cent growth in four months. This reflects refinery operations near capacity. U.S. refining has become the global refining backstop. Facilities elsewhere have run into serious challenges, notably in Venezuela.
Expanding U.S. refining of distillate fuel oil necessarily entails production of gasoline. Gasoline supplies now stand at 234 million barrels, greater than the top of the five-year range. Between gasoline and distillate fuel oil, domestic stocks are well supplied.
The accompanying chart of the Seasonal ULSD Futures price suggests that prices typically top out at this time of year.
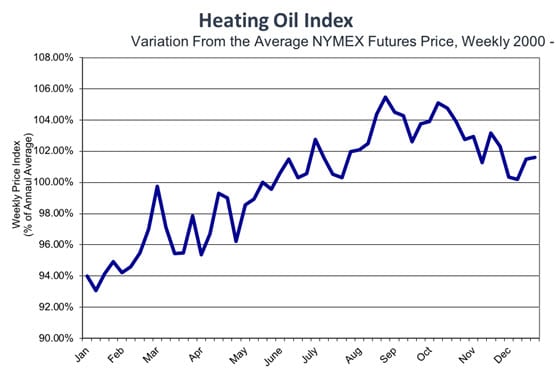
HO Seasonal Price Index 2000-2017 Source: CME, Powerhouse
Domestic refinery operations ran at 95.4 per cent of capacity during the week ending September 14, 2018. This was a modest decline from the prior week, and may be the precursor to an autumn refinery turnaround which could see dramatic declines to avert a glut of supply. Distillate fuel oil production reached 5.5 million barrels daily, reportedly a seasonal record.
Refinery Utilization 1990-2018 Source: EIA, Powerhouse
Supply/Demand Balances
Supply/demand data in the United States for the week ending September 14, 2018 were released by the Energy Information Administration.
Total commercial stocks of petroleum fell 0.4 million barrels during the week ending September 14, 2018.
There were builds in stocks of K-jet fuel, distillate fuel oil, propane, and other oils. There were draws in stocks of gasoline, fuel ethanol, and residual fuel oil.
Commercial crude oil supplies in the United States decreased to 394.1 million barrels, a draw of 2.1 million barrels.
Crude oil supplies decreased in four of the five PAD Districts. PAD District 1 (East Coast) crude oil stocks fell 0.6 million barrels, PADD 2 (Midwest) stocks declined 0.8 million barrels, PADD 3 (Gulf Coast) stocks retreated 1.6 million barrels, and PADD 5 (West Coast) stocks decreased 0.8 million barrels. There was a build of 0.6 million barrels of crude oil in PADD 4 (Rockies).
Cushing, Oklahoma inventories decreased 0.3 million barrels from the previous report week to 22.3 million barrels.
Domestic crude oil production increased 100,000 barrels daily from the previous report week to 11.0 million barrels per day.
Crude oil imports averaged 8.024 million barrels per day, a daily increase of 433,000 barrels per day. Exports increased 539,000 barrels daily to 2.367 million barrels per day.
Refineries used 95.4 per cent of capacity, a decrease of 2.2 percentage points from the previous report week.
Crude oil inputs to refineries decreased 442,000 barrels daily; there were 17.415 million barrels per day of crude oil run to facilities. Gross inputs, which include blending stocks, declined 402,000 barrels daily to 17.748 million barrels daily.
Total petroleum product inventories saw an increase of 1.7 million barrels from the previous report week.
Gasoline stocks decreased 1.7 million barrels from the previous report week; total stocks are 234.2 million barrels.
Demand for gasoline decreased 115,000 barrels per day to 9.534 million barrels per day.
Total product demand increased 564,000 barrels daily to 21.134 million barrels per day.
Distillate fuel oil stocks increased 0.8 million barrels from the previous report week; distillate stocks are 140.1 million barrels. National distillate demand was reported at 4.152 million barrels per day during the report week. This was a weekly increase of 865,000 barrels daily.
Propane stocks rose 0.1 million barrels from the previous report week; propane stock are 74.8 million barrels. Current demand is estimated at 1.179 million barrels per day, a decrease of 70,000 barrels daily from the previous report week.
Natural Gas
According to the Energy Information Administration:
Net injection levels are higher than the five-year average. Net injections into storage totaled 86 Bcf for the week ending September 14, compared with the five-year (2013–17) average net injections of 76 Bcf and last year’s net injections of 96 Bcf during the same week. Working gas stocks totaled 2,722 Bcf, which is 586 Bcf lower than the five-year average and 672 Bcf lower than last year at this time.
Working gas stocks remain lower than the five-year range, although the deficit shrinks this week. The average rate of net injections into storage is 15% lower than the five-year average so far in the 2018 refill season, which covers April through October. If the rate of injections into working gas matched the five-year average of 10.8 Bcf/d for the remainder of the refill season, total inventories would be 3,230 Bcf on October 31, which is 585 Bcf lower than the five-year average of 3,815 Bcf
Natural gas added 22 cents to price in the week ending September 21, despite loss of demand in the Carolinas due to H. Florence. According to Genscape data, the volume of natural gas delivered from interstate transmission pipelines to electric utilities in North Carolina and South Carolina decreased by 0.8 Bcf/d on Saturday, September 15 compared to the previous week―September 7–13―when deliveries averaged 2.0 Bcf/d.
Futures trading involves significant risk and is not suitable for everyone. Transactions in securities futures, commodity and index futures and options on future markets carry a high degree of risk. The amount of initial margin is small relative to the value of the futures contract, meaning that transactions are heavily “leveraged”. A relatively small market movement will have a proportionately larger impact on the funds you have deposited or will have to deposit: this may work against you as well as for you. You may sustain a total loss of initial margin funds and any additional funds deposited with the clearing firm to maintain your position. If the market moves against your position or margin levels are increased, you may be called upon to pay substantial additional funds on short notice to maintain your position. If you fail to comply with a request for additional funds within the time prescribed, your position may be liquidated at a loss and you will be liable for any resulting deficit. Past performance may not be indicative of future results. This is not an offer to invest in any investment program.
Powerhouse is a registered affiliate of Coquest, Inc.
Was this helpful? We’d like your feedback.
Please respond to [email protected]
Copyright © 2018 Powerhouse, All rights reserved