NOAA Winter Forecast: Mild Temps but Chance of Weather Shocks
- NOAA expects temperatures above normal
- NOAA expects precipitation above normal
- OPEC+ could cut production further
- Natural gas storage greater than last year

The Matrix
The Farmer’s Almanacs have spoken. Powerhouse reported their winter expectations on September 2. The Old Farmer’s Almanac (OFA) called for heavy snows and rain and sleet. (Remember, “snow-verload”?)
OFA’s competitor, the Farmer’s Almanac (FA,) has predicted, “freezing, frigid and frosty” weather. It looks for highly variable temperatures. The FA predicts heavy snows for the Great Plains in January.
The National Oceanic and Atmospheric Administration (NOAA) has now published the “official” projection of the federal government. NOAA has its own take.
NOAA sees temperatures above normal for the season for most of the contiguous United States. Regionally, expectations for warm weather are more modest for most of the eastern U.S. This projection is consistent with recent experience; most recent winters have been mild. Nonetheless, intense cold periods and powerful storms have been part of the pattern too.
Precipitation is expected to be above normal for Alaska and for a region north of New Mexico including the Great Plains and the Mississippi Valley. Below normal precipitation is expected on the central Gulf Coast where NOAA is calling for the start of drought conditions.
Forecasting winter weather is always fraught. This year, the challenge is even more demanding. That’s because traditional climate indicators like El Nino or La Nina are not in the mix.
Oil prices depend on more than the impact of weather. Economic expectations include slower global growth and lower demand in 2020. The newly-created OPEC+ group is expected closely to review its schedule of production cuts at its December meeting. Currently, the agreement reduces output by 1.2 million barrels per day. This cut has not led to price support for crude oil even with the brief loss of Saudi Arabian output.
Further loss of demand is already being incorporated into OPEC+ expectations.
Supply/Demand Balances
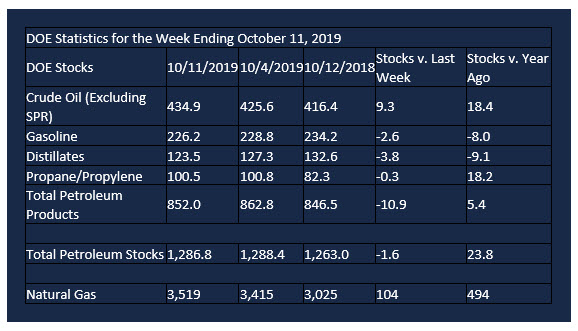
Supply/demand data in the United States for the week ending Oct. 11, 2019, were released by the Energy Information Administration.
Total commercial stocks of petroleum fell by 1.6 million barrels during the week ending Oct. 11, 2019.
Commercial crude oil supplies in the United States increased 9.3 million barrels from the previous report week to 634.9 million barrels.
Crude oil inventory changes by PAD District:
PADD 1: Plus 0.3 million barrels to 11.2 million barrels
PADD 2: Plus 1.8 million barrels to 128.4 million barrels
PADD 3: Plus 5.5 million barrels to 226.9 million barrels
PADD 4: Plus 0.9 million barrels to 21.2 million barrels
PADD 5: Plus 0.7 million barrels to 47.1 million barrels
Cushing, Oklahoma inventories rose 1.3 million barrels from the previous report week to 43.0 million barrels.
Domestic crude oil production was unchanged from the previous week at 12.6 million barrels per day.
Crude oil imports averaged 6.295 million barrels per day, a daily increase of 70,000 barrels. Exports fell 153,000 barrels daily to 3.248 million barrels per day.
Refineries used 83.1 percent of capacity, down 2.6% from the previous report week.
Crude oil inputs to refineries decreased 220,000 barrels daily; there were 15.436 million barrels per day of crude oil run to facilities. Gross inputs, which include blending stocks, fell 490,000 barrels daily to reach 15.617 million barrels daily.
Total petroleum product inventories fell 11.0 million barrels from the previous report week.
Gasoline stocks decreased 1.2 million barrels daily from the previous report week; total stocks are 228.8 million barrels.
Demand for gasoline rose 323,000 barrels per day to 9.460 million barrels per day.
Total product demand increased 655,000 barrels daily to 21.406 million barrels per day.
Distillate fuel oil stocks decreased 3.9 million barrels from the previous report week; distillate stocks are at 127.3 million barrels. EIA reported national distillate demand at 4.036 million barrels per day during the report week, an increase of 77,000 barrels daily.
Propane stocks increased 0.1 million barrels from the previous report week; propane stocks are 100.8 million barrels. The report estimated current demand at 1.088 barrels per day, a decrease of 36,000 barrels daily from the previous report week.
Natural Gas
Natural gas prices have been moving lower since mid-September when they topped at $2.71. This completed a rally from August’s $2.03 low and was the most sustained advance in 2019. Natural gas production and generally benign weather combined to limit the rally.
Prices have since retraced most of the rally, touching $2.21. Hurricane season is past its peak. Global economic activity has been struggling. Winter weather in the United States is expected to be warmer than average.
Producers should consider these factors when placing their next protective hedge. Support is now at $2.18. A test of $2.02 would complete retracement of the August-September rally.
According to the Energy Information Administration:
Net injections into storage totaled 104 Bcf for the week ending October 11, compared with the five-year (2014–18) average net injections of 81 Bcf and last year’s net injections of 82 Bcf during the same week. Working gas stocks totaled 3,519 Bcf, which is 14 Bcf more than the five-year average and 494 Bcf more than last year at this time.
The average rate of net injections into storage is 27% higher than the five-year average so far in the refill season (April through October). If the rate of injections into storage matched the five-year average of 9.3 Bcf/d for the remainder of the refill season, total inventories would be 3,706 Bcf on October 31, which is 14 Bcf higher than the five-year average of 3,692 Bcf for that time of year.
Futures trading involves significant risk and is not suitable for everyone. Transactions in securities futures, commodity and index futures and options on future markets carry a high degree of risk. The amount of initial margin is small relative to the value of the futures contract, meaning that transactions are heavily “leveraged”. A relatively small market movement will have a proportionately larger impact on the funds you have deposited or will have to deposit: this may work against you as well as for you. You may sustain a total loss of initial margin funds and any additional funds deposited with the clearing firm to maintain your position. If the market moves against your position or margin levels are increased, you may be called upon to pay substantial additional funds on short notice to maintain your position. If you fail to comply with a request for additional funds within the time prescribed, your position may be liquidated at a loss and you will be liable for any resulting deficit. Past performance may not be indicative of future results. This is not an offer to invest in any investment program.
Powerhouse is a registered affiliate of Coquest, Inc.
Was this helpful? We’d like your feedback.
Please respond to [email protected]
Copyright© 2019 Powerhouse, All rights reserved.