Distillate Fuel Oil Prices Vault Higher
- ULSD prices add 75 cents to spot futures
- Distillate fuel oil supply falls below 30 days
- OPEC+ production cut less than it seems to be
- Natural gas supply shortfall diminishes
Sincerely,
Alan Levine, Chairman
Powerhouse
(202) 333-5380
The Matrix
Distillate fuel oil spot futures prices nearly reached resistance at $4.1150 as the week of October 7 ended. A slight increase in refinery production of distillates, and little change to import/export balances during the week were not enough to allay growing concerns for winter ULSD availability. Futures prices rose nearly seventy-five cents, closing very near the weekly high.
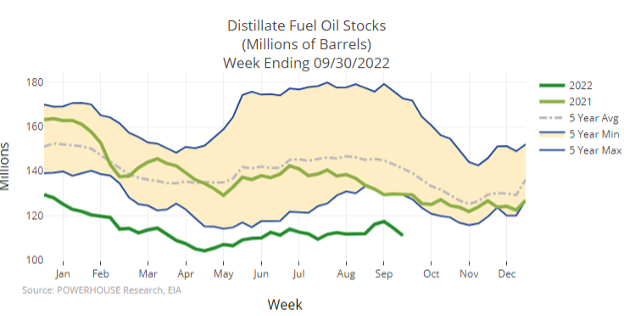
Inventories of distillate fuel oil lost 3.4 million barrels during the week. This was only part of a loss of ten million barrels of commercial oil stocks for the week ended September 30, 2022. The losses could become a recipe for real hardship this winter should weather be as demanding as many forecasters have suggested.
There are now fewer than thirty days’ distillate supply in the United States – moving further below the 36.5 days’ supply typical for this time of year. And concerns for the condition of our domestic distribution system add to problems for supply managers.
The situation developing in Europe has become even more unpredictable. Most immediately, more than 60% of France’s refining capacity is down because of strikes over wages. This has pressured prices higher and added to upside price pressure. Imports have risen as well, draining already tight global supplies. Russian losses on the battlefield, ironically in regions of Ukraine formally annexed by Russia, have been at least an embarrassment. This has raised fears that Russia could turn to nuclear weapons, inviting escalation from the EU and the United States. As the weekend began, the bridge that connects Crimea to the mainland sustained major damage, adding to regional chaos.
With all this happening in Europe, the OPEC+ announcement that it would reduce production by two million barrels daily would seem to be almost a footnote to last week’s activity. And perhaps it was.
An ostensible reduction of two million barrels daily supply from OPEC+ will certainly be much less in reality. Many OPEC countries are already struggling to produce to quota. One analyst puts the effective cut at perhaps 750,000 barrels per day. It is, nonetheless, material.
The implications for inflation and, now, probable further Fed rate hikes invites speculation on possible recession. It also casts the long-standing relationship between the United States and Saudi Arabia in a new light. But new light has done little to illuminate the path of global geopolitics going forward.
Supply/Demand Balances
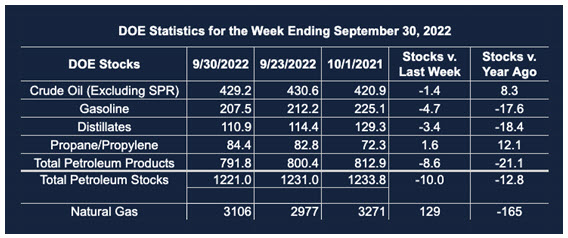
Supply/demand data in the United States for the week ended September 30, 2022, were released by the Energy Information Administration.
Total commercial stocks of petroleum fell 10.0 million barrels during the week ended September 23, 2022.
Commercial crude oil supplies in the United States decreased by 1.4 million barrels from the previous report week to 429.2 million barrels.
Crude oil inventory changes by PAD District:
PADD 1: Down 0.1 million barrels to 8.1 million barrels
PADD 2: Plus 2.0 million barrels to 110.2 million barrels
PADD 3: Down 1.0 million barrels to 240.8 million barrels
PADD 4: Down 0.6 million barrels to 23.1 million barrels
PADD 5: Down 1.7 million barrels to 46.9 million barrels
Cushing, Oklahoma, inventories were up 0.3 million barrels from the previous report week to 26.0 million barrels.
Domestic crude oil production was unchanged from the previous report week at 12.0 million barrels daily.
Crude oil imports averaged 5.947 million barrels per day, a daily decrease of 502,000 barrels. Exports decreased 95,000 barrels daily to 4.551 million barrels per day.
Refineries used 91.3% of capacity; 0.7 percentage points higher than the previous report week.
Crude oil inputs to refineries increased 210,000 barrels daily; there were 15.961 million barrels per day of crude oil run to facilities. Gross inputs, which include blending stocks, rose 133,000 barrels daily to 16.388 million barrels daily.
Total petroleum product inventories dropped by 8.6 million barrels from the previous report week, falling to 791.8 million barrels.
Total product demand increased 61,000 barrels daily to 20.831 million barrels per day.
Gasoline stocks decreased 4.7 million barrels from the previous report week; total stocks are 207.5 million barrels.
Demand for gasoline increased 640,000 barrels per day to 9.465 million barrels per day.
Distillate fuel oil stocks decreased 3.4 million barrels from the previous report week; distillate stocks are at 110.9 million barrels. EIA reported national distillate demand at 4.105 million barrels per day during the report week, a decrease of 73,000 barrels daily.
Propane stocks increased by 1.6 million barrels from the previous report week to 84.4 million barrels. The report estimated current demand at 930,000 barrels per day, an increase of 12,000 barrels daily from the previous report week. Supply/demand data in the United States for the week ended September 23, 2022, were released by the Energy Information Administration.
Total commercial stocks of petroleum fell 8.9 million barrels during the week ended September 23, 2022.
Commercial crude oil supplies in the United States decreased by 0.2 million barrels from the previous report week to 430.6 million barrels.
Crude oil inventory changes by PAD District:
PADD 1: Down 0.3 million barrels to 8.2 million barrels
PADD 2: Plus 1.3 million barrels to 108.2 million barrels
PADD 3: Down 2.9 million barrels to 241.8 million barrels
PADD 4: Plus 0.6 million barrels to 23.7 million barrels
PADD 5: Plus 1.1 million barrels to 48.6 million barrels
Cushing, Oklahoma inventories were up 0.7 million barrels from the previous report week to 25.7 million barrels.
Domestic crude oil production was down 100,000 barrels per day from the previous report week at 12.0 million barrels daily.
Crude oil imports averaged 6.449 million barrels per day, a daily decrease of 498,000 barrels. Exports increased 1,106,000 barrels daily to 4.646 million barrels per day.
Refineries used 90.6% of capacity; 3.0 percentage points lower than the previous report week.
Crude oil inputs to refineries decreased 604,000 barrels daily; there were 15.751 million barrels per day of crude oil run to facilities. Gross inputs, which include blending stocks, fell 538,000 barrels daily to 16.255 million barrels daily.
Total petroleum product inventories dropped by 8.7 million barrels from the previous report week, falling to 800.4 million barrels.
Total product demand increased 1,832,000 barrels daily to 20.770 million barrels per day.
Gasoline stocks decreased 2.4 million barrels from the previous report week; total stocks are 212.2 million barrels.
Demand for gasoline increased 504,000 barrels per day to 8.825 million barrels per day.
Distillate fuel oil stocks decreased 2.9 million barrels from the previous report week; distillate stocks are at 114.4 million barrels. EIA reported national distillate demand at 4.178 million barrels per day during the report week, an increase of 768,000 barrels daily.
Propane stocks increased by 1.6 million barrels from the previous report week to 82.8 million barrels. The report estimated current demand at 918,000 barrels per day, an increase of 66,000 barrels daily from the previous report week.
Natural Gas
Injections into underground storage for the week ended October 5, 2022, were larger than expected. EIA put injections at 129 B/cf, above the median estimate of industry experts who predicted injections of 121 B/cf. The shortfall to last year’s injections brought supply to 5% lower as the injection period draws to a close.
The weekly injection was the second highest on record, nearly reaching the 132 Bcf recorded in 2015. Higher-than-anticipated additions to supply in recent weeks have reduced the nation’s current natural gas deficit to 8% below the average of the past five years.
This development eases concerns over winter supply to some degree. We are not out of the woods because expanding exports of LNG and the return to service of the facility at Freeport, Louisiana, are likely to increase pressure on domestic supplies.
Futures prices for the Henry Hub contract began last week on an up note as they crossed the technically important 200-day moving average and advanced to $7.19. The injection report reversed that, but not enough to break support at $6.31.
According to the EIA:
Net injections [of natural gas] into storage totaled 129 Bcf for the week ended September 30, compared with the five-year (2017–2021) average net injections of 87 Bcf and last year’s net injections of 114 Bcf during the same week. Working natural gas stocks totaled 3,106 Bcf, which is 264 Bcf (8%) lower than the five-year average and 165 Bcf (5%) lower than last year at this time.
The average rate of injections into storage is 1% higher than the five-year average so far in the refill season (April through October). If the rate of injections into storage matched the five-year average of 8.9 Bcf/d for the remainder of the refill season, the total inventory would be 3,381 Bcf on October 31, which is 264 Bcf lower than the five-year average of 3,645 Bcf for that time of year.
Was this helpful? We’d like your feedback.
Please respond to [email protected]
Powerhouse Futures & Trading Disclaimer
Copyright 2022 Powerhouse Brokerage, LLC, All rights reserved