

Global Distillate Fuel Oil Supplies Are Tight
- ULSD prices top resistance
- Crack spreads tend to top in October
- Refinery turnarounds nearing top?
- Natural gas wholesale prices could fall 24 % (EIA)

The Matrix
Muted trading of energy futures reflects the uncertainty many dealers have felt in recent months. Global issues like the U.S./China Trade War and chaotic response to Brexit in Europe have caused many to stand aside and defer establishing hedge positions.
ULSD hedges for the following winter are often established in late summer and early fall. This may explain the $0.1167 rally in ULSD that took prices through resistance at $1.95 before settling at $1.9576 on October 11.
Traders should be cautious, however. In recent weeks, refineries have been undergoing autumn turnaround to prepare facilities for more intense production of ULSD and less intense RBOB. Refinery turnaround has the effect of reducing product output and increasing crude oil stocks while deferring production.
EIA’s weekly supply/demand report helps our understanding. The report for the week ending October 4 shows crude oil inputs to refineries at 15.656 million barrels daily, relatively low for this time of year. It also shows refinery utilization at 85.7 percent of capacity. Lower utilization backs up crude oil, a bearish situation. It also reduces the availability of products. Crack spreads, in which products are bought and crude oils are sold, are often purchased.
The seasonal impact of refinery turnarounds follows a typical pattern. The accompanying chart of U.S. refinery turns shows refinery shut-ins topping in March and in October. The October top, according to this chart, comes around this time. And as refineries come out of turnaround, more product is made, using more crude oil. The crack spread can lose its bullish momentum.
At the same time, however, distillate fuel oil stocks are getting tighter. The global distillate fuel oil situation is tightening. The chart below summarises all oil inventory data available for the US from the EIA, Antwerp-Rotterdam-Amsterdam (ARA) from Genscape and PJK, Japan from PAJ, Singapore from IE, and the Fujairah hub (UAE.) Distillate fuel oil inventories are at the five-year low, reflecting refinery turnaround and preparations for the IMO 2020 introduction of VLSFO on January first, 2020.
Supply/Demand Balances
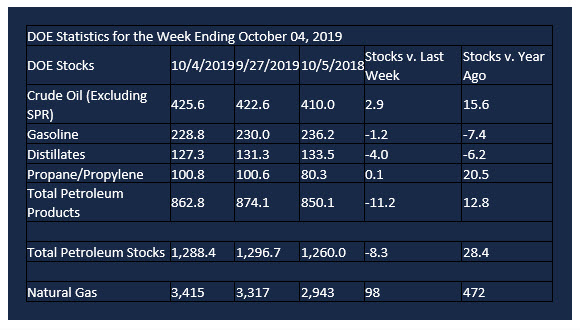
Supply/demand data in the United States for the week ending Oct.4, 2019, were released by the Energy Information Administration.
Total commercial stocks of petroleum fell by 8.3 million barrels during the week ending Oct. 4, 2019.
Commercial crude oil supplies in the United States increased 2.9 million barrels from the previous report week to 425.6 million barrels.
Crude oil inventory changes by PAD District:
PADD 1: Minus 0.9 million barrels to 10.9 million barrels
PADD 2: Minus 0.9 million barrels to 126.6 million barrels
PADD 3: Plus 5.6 million barrels to 221.4 million barrels
PADD 4: Minus 0.1 million barrels to 20.3 million barrels
PADD 5: Minus 0.9 million barrels to 46.4 million barrels
Cushing, Oklahoma inventories rose 1.0 million barrels from the previous report week to 41.7 million barrels.
Domestic crude oil production rose 200,000 daily from the previous report week to 12.6 million barrels per day.
Crude oil imports averaged 6.224 million barrels per day, a daily decrease of 67,000 barrels. Exports rose 534,000 barrels daily to 3.401 million barrels per day.
Refineries used 85.7 percent of capacity, down 0.7% from the previous report week.
Crude oil inputs to refineries decreased 361,000 barrels daily; there were 15.656 million barrels per day of crude oil run to facilities. Gross inputs, which include blending stocks, fell 145,000 barrels daily to reach 16.107 million barrels daily.
Total petroleum product inventories fell 11.0 million barrels from the previous report week.
Gasoline stocks decreased 1.2 million barrels daily from the previous report week; total stocks are 228.8 million barrels.
Demand for gasoline rose 323,000 barrels per day to 9.460 million barrels per day.
Total product demand increased 655,000 barrels daily to 21.406 million barrels per day.
Distillate fuel oil stocks decreased 3.9 million barrels from the previous report week; distillate stocks are at 127.3 million barrels. EIA reported national distillate demand at 4.036 million barrels per day during the report week, an increase of 77,000 barrels daily.
Propane stocks increased 0.1 million barrels from the previous report week; propane stocks are 100.8 million barrels. The report estimated current demand at 1.088 barrels per day, a decrease of 36,000 barrels daily from the previous report week.
Natural Gas
The Energy Information Administration expects spending for residential space heating with natural gas to be about one percent lower than last year during the upcoming winter. Lower spending reflects expectations that space heating demand will be four percent lower (in HDDs) in the United States. The EIA expects wholesale prices for natural gas to be 24 percent lower. Prices should average around $2.66 per Mmcf. Increasing production and growing inventory levels add to the bearish view.
According to the Energy Information Administration:
Net injections into storage totaled 98 Bcf for the week ending October 4, compared with the five-year (2014–18) average net injections of 89 Bcf and last year’s net injections of 91 Bcf during the same week. Working gas stocks totaled 3,415 Bcf, which is 9 Bcf lower than the five-year average and 472 Bcf more than last year at this time.
The average rate of net injections into storage is 27% higher than the five-year average so far in the refill season (April through October). If the rate of injections into storage matched the five-year average of 9.9 Bcf/d for the remainder of the refill season, total inventories would be 3,683 Bcf on October 31, which is 9 Bcf lower than the five-year average of 3,692 Bcf for that time of year.
Futures trading involves significant risk and is not suitable for everyone. Transactions in securities futures, commodity and index futures and options on future markets carry a high degree of risk. The amount of initial margin is small relative to the value of the futures contract, meaning that transactions are heavily “leveraged”. A relatively small market movement will have a proportionately larger impact on the funds you have deposited or will have to deposit: this may work against you as well as for you. You may sustain a total loss of initial margin funds and any additional funds deposited with the clearing firm to maintain your position. If the market moves against your position or margin levels are increased, you may be called upon to pay substantial additional funds on short notice to maintain your position. If you fail to comply with a request for additional funds within the time prescribed, your position may be liquidated at a loss and you will be liable for any resulting deficit. Past performance may not be indicative of future results. This is not an offer to invest in any investment program.
Powerhouse is a registered affiliate of Coquest, Inc.
Was this helpful? We’d like your feedback.
Please respond to [email protected]
Copyright© 2019 Powerhouse, All rights reserved.


