U.S. Crude Oil Production Explodes
- U.S. crude oil output reaches 11.6 million million barrels daily
- EIA projects 12 million barrels per day in second quarter, 2019
- Russia and Saudi Arabia discussing cuts in 2019 output
- Natural gas price rally catches many buyers flat-footed.

The Matrix
The Energy Information Administration reported U.S. crude oil production of 11.6 million barrels daily for the week ending November 2, 2018. This was record output and was a 400,000 barrel-per-day increase over the prior week. And it’s consistent with EIA’s latest projection of crude oil output for 2019 that puts output at 12.06 million barrels daily. The details of the projection include an expectation that U.S. output will break 12 million barrels per day as soon as the second quarter. More important, however, this level of output will solidify the United States’ position as a key leader in global petroleum policy.
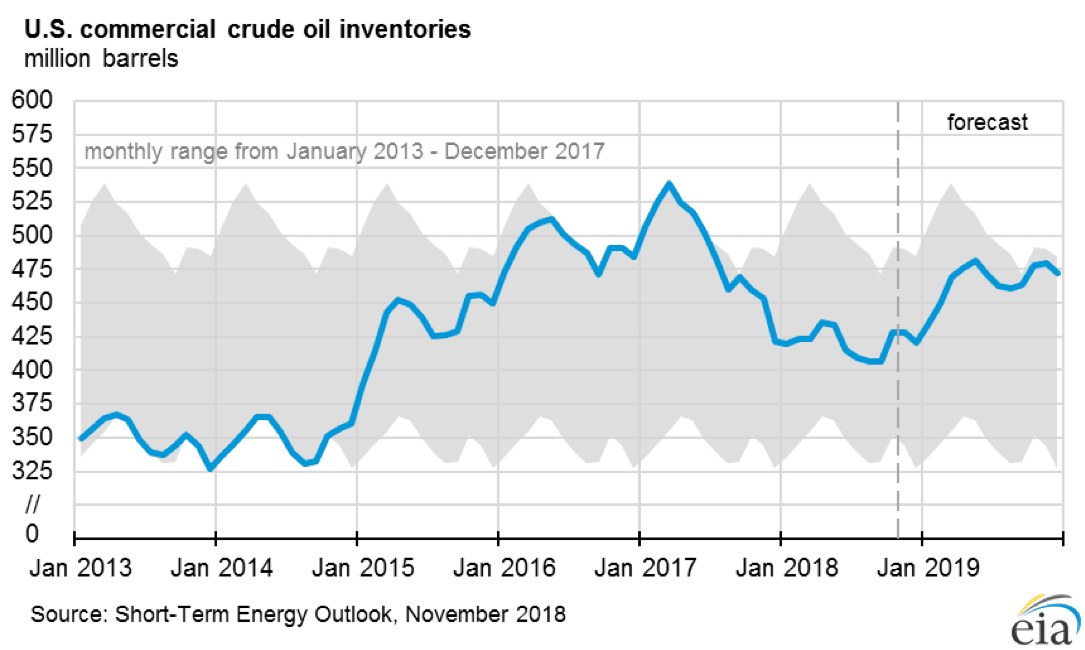
US Commercial Crude Oil Inventories 2013 – 2019 Source: EIA
It was bearish for price and was reflected in a 5.8-million-barrel increase in crude oil inventories. It comes at a time when concerns over an international economic slowdown are growing. In particular, tensions between the United States and China could inhibit further economic gains.
There are offsetting bullish factors that could limit the downward pressure on prices. Russia and Saudi Arabia have reportedly been in discussions about cutting production in 2019. This is against a background of failing production by several traditional suppliers and uncertainty about the implementation of sanctions on Iran. Early in 2018, a modest crude oil surplus served to retard OPEC production increases. By mid-year, demand had picked up, the situation in Venezuela became more apparent and Saudi Arabia and Russia boosted supply.
The remarkable expansion of American shale production now in the books should certainly lead to a review of Russo/Saudi Arabian plans for 2019. Lower output by these two production leaders will have to be set against lower contributions to supply by Venezuela and Libya and others now bumping into production ceilings from traditional fields. Finding the right balance will be a serious challenge next year.
Supply/Demand Balances
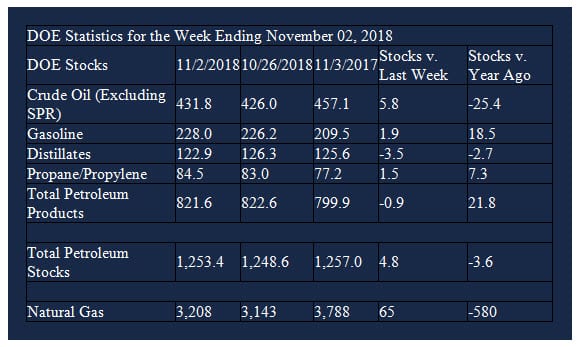
Supply/demand data in the United States for the week ending November 2, 2018 were released by the Energy Information Administration.
Total commercial stocks of petroleum increased 4.8 million barrels during the week ending November 2, 2018.
There were builds in stocks of gasoline, fuel ethanol, residual fuel, and propane. There were draws in stocks of K-jet fuel, distillates, and other oils.
Commercial crude oil supplies in the United States increased to 431.8 million barrels, a build of 5.8 million barrels.
Crude oil supplies increased in three of the five PAD Districts. PAD District 2 (Midwest) stocks increased 2.3 million barrels, PADD 3 (Gulf Coast) stocks rose 4.9 million barrels, and PADD 4 (Rockies) stocks were up 0.4 million barrels. PADD 1 (East Coast) stocks declined 1.7 million barrels and PADD 5 (west Coast) stocks fell 0.3 million barrels.
Cushing, Oklahoma inventories increased 2.4 million barrels from the previous report week to 34.3 million barrels.
Domestic crude oil production was up 400,000 barrels per day from the previous report week to 11.6 million barrels per day.
Crude oil imports averaged 7.539 million barrels per day, a daily increase of 195,000 barrels per day. Exports fell 80,000 barrels daily to 2.405 million barrels per day.
Refineries used 90.0 per cent of capacity, an increase of 0.6 percentage points from the previous report week.
Crude oil inputs to refineries decreased 9,000 barrels daily; there were 16.408 million barrels per day of crude oil run to facilities. Gross inputs, which include blending stocks, increased 115,000 barrels daily to 16.740 million barrels daily.
Total petroleum product inventories fell 1.0 million barrels from the previous report week.
Gasoline stocks increased 1.9 million barrels from the previous report week; total stocks are 228.0 million barrels.
Demand for gasoline decreased 162,000 barrels per day to 9.099 million barrels per day.
Total product demand decreased 611,000 barrels daily to 20.386 million barrels per day.
Distillate fuel oil stocks decreased 3.5 million barrels from the previous report week; distillate stocks are 122.9 million barrels. National distillate demand was reported at 4.318 million barrels per day during the report week. This was a weekly decrease of 108,000 barrels daily.
Propane stocks increased 1.5 million barrels from the previous report week; propane stock are 84.5 million barrels. Current demand is estimated at 0.907 million barrels per day, a decrease of 475,000 barrels daily from the previous report week.
Natural Gas
According to the Energy Information Administration:
Natural gas stocks ended the refill season lower than the five-year minimum in all regions. Working natural gas in storage in the Lower 48 states as of October 31 totaled 3,208 billion cubic feet (Bcf), according to interpolated data from EIA’s Weekly Natural Gas Storage Report released November 8. Inventories as of October 31 were 598 Bcf (16%) lower than the five-year (2013–17) end-of-October average and 569 Bcf (15%) lower than last year. This level is the lowest end-of-refill season level for working gas stocks since 2005, and inventory levels in all regions were lower than their five-year minimums. Although the natural gas storage injection season is traditionally defined as April 1 through October 31, injections often occur into November.
Expectations of colder weather were reflected in an end-of-week rally on November ninth. Spot natural gas futures broke through resistance at $3.66. This level was last seen early last February. Additional resistance was established at $3.99 at year-end 2016.
This rally has caught many buyers flat-footed. Natural gas open interest has been declining throughout October, indicating that fewer buyers were covering their needs. There were 1.7 million natural gas futures at their recent high on October 4th. By November 7, open interest fell to 1.5 million contracts, a drop of 12 per cent. This is consistent with natural gas futures price patterns. This is shown in Powerhouse’s chart below. Typically, natural gas prices bottom in September, moves higher into October when a flat period occurs before a further rally into year-end. We expect 2018 to closely follow that pattern.
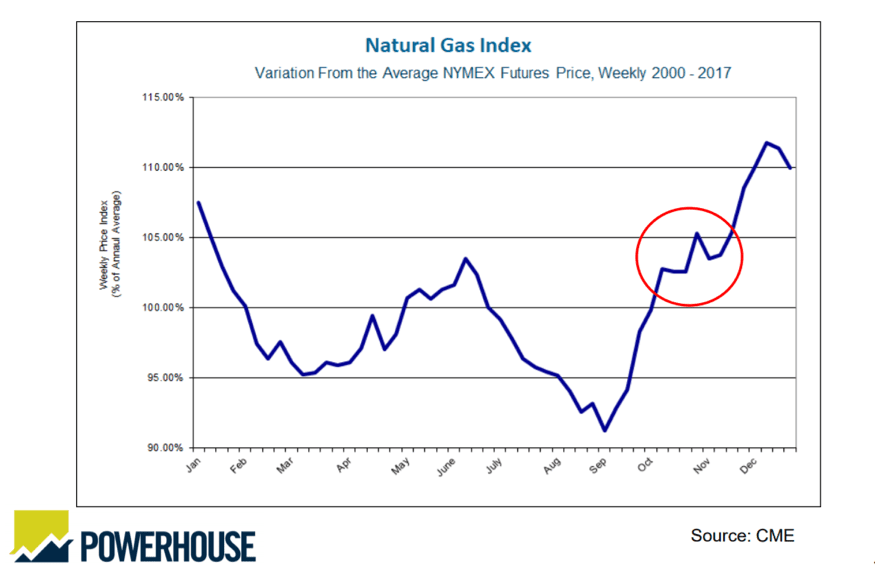
Seasonal Price Trends: Natural Gas 2000 – 2018 Source: POWERHOUSE
Futures trading involves significant risk and is not suitable for everyone. Transactions in securities futures, commodity and index futures and options on future markets carry a high degree of risk. The amount of initial margin is small relative to the value of the futures contract, meaning that transactions are heavily “leveraged”. A relatively small market movement will have a proportionately larger impact on the funds you have deposited or will have to deposit: this may work against you as well as for you. You may sustain a total loss of initial margin funds and any additional funds deposited with the clearing firm to maintain your position. If the market moves against your position or margin levels are increased, you may be called upon to pay substantial additional funds on short notice to maintain your position. If you fail to comply with a request for additional funds within the time prescribed, your position may be liquidated at a loss and you will be liable for any resulting deficit. Past performance may not be indicative of future results. This is not an offer to invest in any investment program.
Powerhouse is a registered affiliate of Coquest, Inc.
Was this helpful? We’d like your feedback.
Please respond to [email protected]
Copyright© 2018 Powerhouse, All rights reserved.