

Petroleum Pricing Presents a Puzzle
- Crude oil inventories build, Product supplies fall
- Crude oil exports reach 4.3 million barrels
- SPR refill is bullish
- Natural gas in storage 30% more than last year at this time.
Sincerely,
Alan Levine, Chairman
Powerhouse
(202) 333-5380
The Matrix
Oil futures ended last week with mixed results. RBOB recorded its third week of higher closings. The four-week average of U.S. gasoline product supplied, the term the Energy Information Administration uses to signify demand – rose in the latest week to the highest level since December 2021. The four-week average rose by about 1.1% in the week ended May 12 to 9.1 million barrels per day.
ULSD managed a small weekly price increase while demand slowed to 3.8 million barrels daily year-to-date. While distillate demand has improved over the last four months (in late January, the rolling 4-week average of distillate demand was running 13% behind the prior year period, now demand is roughly even to last year for the same period) reports of weakness in manufacturing have kept diesel prices moving sideways.
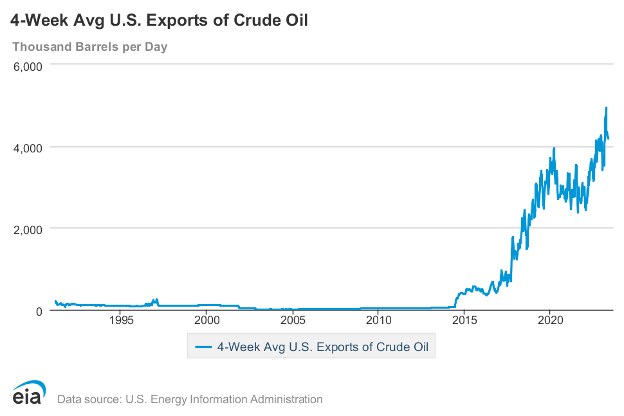
WTI crude oil futures moved a bit higher during the week, but not enough to materially change its’ price trajectory. The rally came while inventories of crude oil in the United States gained five million barrels, but exports of crude oil continued to expand. Outflows of crude oil reached 4.3 million barrels daily during the week. Last year, they were 3.5 million daily barrels for the same week.
The chart below shows the impressive growth in U.S. exports. It signals a change in the status of America in the world oil economy. We are still the major focus of global demand, but our supply to other countries is increasing our importance to supply as well.
In February 2023, the United States exported four million barrels of crude oil daily. The exports had a geographic sweep. Major refinery centers in Europe took 876,000 barrels daily. Canada received 343,000 barrels per day. Singapore received 467,000 barrels daily, China took 441,000 daily barrels, and South Korea, 386,000 barrels per day. Together, this represents a major position in world crude oil supply, enhancing our importance in global economics.
A bullish note was added by the government’s solicitation of up to three million barrels to the Strategic Petroleum Reserve. The Reserve now holds 360 million barrels of crude oil, much diminished from before last year when more than 200 million were taken to commercial markets. The government’s objective then was to curb gasoline prices. Ironically, deliveries under this solicitation would see occur in August, potentially boosting prices during the driving season.
Supply/Demand Balances
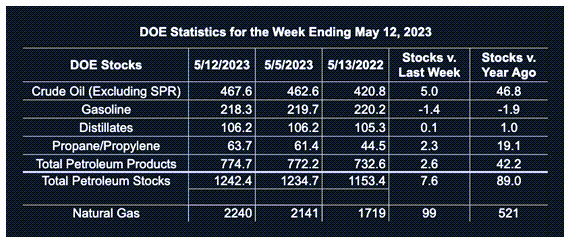
Supply/demand data in the United States for the week ended May 12, 2023, were released by the Energy Information Administration.
Total commercial stocks of petroleum rose (⬆) 7.6 million barrels to 1.2424 billion barrels during the week ended May 12, 2023.
Commercial crude oil supplies in the United States were higher (⬆) by 5 million barrels from the previous report week to 467.6 million barrels.
Crude oil inventory changes by PAD District:
PADD 1: Down (⬇) 0.1 million barrels at 8.7 million barrels
PADD 2: Up (⬆) 2.8 million barrels to 122.7 million barrels
PADD 3: Up (⬆) 2.4 million barrels to 256.2 million barrels
PADD 4: Up (⬆) 0.6 million barrels to 27.4 million barrels
PADD 5: Down (⬇) 0.7 million barrels to 52.6 million barrels
Cushing, Oklahoma, inventories were Up (⬆) 1.5 million barrels from the previous report week to 35.5 million barrels.
Domestic crude oil production was down (⬇) 100,000 barrels at 12.2 million barrels daily.
Crude oil imports averaged 6.860 million barrels per day, a daily increase (⬆) of 1.306 million barrels. Exports increase (⬆) 1.434 million barrels daily to 4.310 million barrels per day.
Refineries used 92.0% of capacity; 1.0 percentage points higher (⬆) than the previous report week.
Crude oil inputs to refineries increased (⬆) 245,000 barrels daily; there were 15.990 million barrels per day of crude oil run to facilities. Gross inputs, which include blending stocks, increased (⬆) 192,000 barrels daily to 16.594 million barrels daily.
Total petroleum product inventories increased (⬆) by 2.7 million barrels from the previous report week, up to 774.8 million barrels.
Total product demand decreased (⬇) 606,000 barrels daily to 19.558 million barrels per day.
Gasoline stocks decreased (⬇) 1.4 million barrels from the previous report week; total stocks are 218.3 million barrels.
Demand for gasoline decreased (⬇) 395,000 barrels per day to 8.908 million barrels per day.
Distillate fuel oil stocks decreased (⬆) 0.1 million barrels from the previous report week; distillate stocks are at 106.2 million barrels. EIA reported national distillate demand at 3.736 million barrels per day during the report week, a decrease (⬇) of 299,000 barrels daily.
Propane stocks increased (⬆) by 2.3 million barrels from the previous report week to 63.7 million barrels. The report estimated current demand at 618,000 barrels per day, an increase (⬆) of 163,000 barrels daily from the previous report week.
Natural Gas
Injections into underground storage for the week ended May 12 clocked in at 99 Bcf. This was substantially higher than either last year or the average of the past five years. It reflects the failure to produce substantial degree days for cooling or heating.
The industry anticipated even higher injections. Analysts’ median expectations were 108 Bcf. By this standard, injections were seen as bullish and spot futures moved higher. The week settled at $2.585, the highest close since March 10. Prices remain in the recent range, however, and need to move above $3.03 to break out.
Markets are focusing on natural gas as the more desirable fossil fuel as we move toward a renewable-fuels future. The sources of natural gas, then, becomes important for planning supply. EIA has provided a guide to one such source, associated natural gas. This gas is a co-product of wells that produce crude oil.
EIA notes “Historically, associated natural gas has been a relatively small proportion of U.S. natural gas supply. In 2010, associated natural gas production totaled 3.7 billion cubic feet per day (Bcf/d), accounting for about 6% of domestic production. By 2022, associated natural gas production had increased to 15.4 Bcf/d, or more than 15% of domestic natural gas production.”
The importance of associated natural gas is expected to grow from 19.8 Bcf/d in 2025 to 24.2 Bcf/d in 2050. Several factors support this idea. Higher crude oil prices forecast by EIA will increase production from tight oil formations, yielding more associated natural gas. Also, as wells age, the ratio of natural gas to oil increases. And part of the reason is regulatory. The Industrial Recovery Act penalizes venting and flaring methane. Creating incentives to capture more associated natural gas.
According to the EIA:
Natural gas injections into storage totaled 99 Bcf for the week ended May 12, compared with the five-year (2018–2022) average net injections of 91 Bcf and last year’s net injections of 87 Bcf during the same week. Working natural gas stocks totaled 2,240 Bcf, which is 340 Bcf (18%) more than the five-year average and 521 Bcf (30%) more than last year at this time.
Was this helpful? We’d like your feedback.
Please respond to [email protected]
Powerhouse Futures & Trading Disclaimer
Copyright 2023 Powerhouse Brokerage, LLC, All rights reserved


