

Petroleum Pricing at an Inflection Point?
- Oil prices mostly flat last week
- Geopolitical concerns focus on Russia
- U.S. supply sufficiency modestly lower
- Natural gas storage is in excess
Sincerely
Alan Levine, Chair
Powerhouse
(202) 333-5380

The Matrix
Two weeks ago, sharp price decreases accompanied hopes for regional calming in the Middle East. The downdraft tempered last week. WTI crude oil futures and distillate fuel oil prices ended the week essentially where they began it.
Gasoline futures, however, showed further weakness. Prices entered a gap that, when filled, would bring prices to $2.36, where they were in February. The top for spring gasoline prices generally occurs around Memorial Day. We are not far from that point.
The geopolitical world rarely stands still. Renewed conflict in the Russia-Ukraine war took center stage again. Russia has made notable advances recently, with assaults on the Kharkiv region, forcing evacuations. Russia attacked Ukrainian electricity facilities early last week. Ukraine responded with drones. A Lukoil fuel terminal near Crimea was hit, as was a Gazprom oil refinery more than one thousand miles beyond the border.
The U.S. Petroleum Balance Sheet for the Week Ended May 3 reported further erosion of the domestic inventory position. The Energy Information Administration showed a decline of 1.4 million barrels of crude oil during the week.
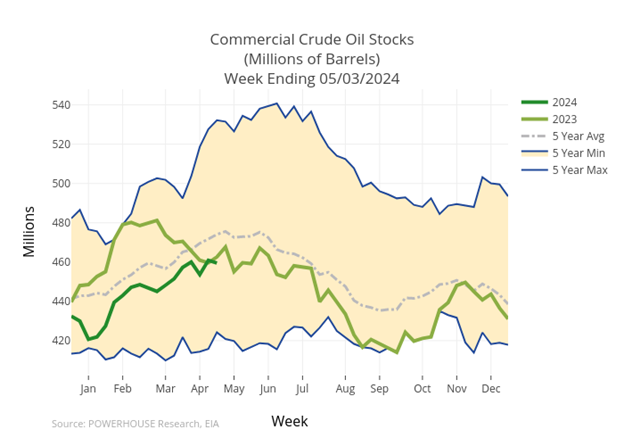
Crude oil supplies have been falling since June 2020. They are now at 459.5 million barrels. This is a 15% reduction in domestic commercial stocks since June 2020, when they topped at 540.7 million barrels.
The reduction in domestic crude oil inventories reflects, in large part, an increase in U.S. exports. Shale oil production has led to a major shift in the country’s role as a global power in oil supply. Crude oil exports were 3.2 million barrels daily in June 2020, and the most recent Petroleum Balance reported exports of 4.5 million barrels per day, a gain of 40.6%.
Domestic production has been steady at 13.1 million barrels daily since March 8, 2024, coming off an all-time February high of 13.3 million barrels daily. Petroleum demand has been steady over the past few years, muting the impact on domestic oil self-sufficiency.
Global geopolitics have boiled over. Access to domestic supply is a central focus of national security today.
Supply/Demand Balances
Supply/demand data in the United States for the week ended May 3, 2024, were released by the Energy Information Administration.
Total commercial stocks of petroleum decreased (⬇) 2.1 million barrels to 1,239.5 billion barrels during the week ended May 3, 2024.
Commercial crude oil supplies in the United States were lower (⬇) by 1.4 million barrels from the previous report week to 459.5 million barrels.
Crude oil inventory changes by PAD District:
PADD 1: Up (⬆) 0.5 million barrels to 8.8 million barrels
PADD 2: Up (⬆) 1.7 million barrels to 122.4 million barrels
PADD 3: Down (⬇) 2.5 million barrels to 259 million barrels
PADD 4: Up (⬆) 0.2 million barrels at 25 million barrels
PADD 5: Down (⬇) 1.1 million barrels to 44.3 million barrels
Cushing, Oklahoma, inventories were 1.9 million barrels higher (⬆) at 35.3 million barrels.
Domestic crude oil production was unchanged (=) at 13.1 million barrels daily.
Crude oil imports averaged 6.969 million barrels per day, a daily increase (⬆) of 197,000 barrels. Exports increased (⬆) 550,000 barrels daily to 4.468 million barrels per day.
Refineries used 88.5% of capacity; 1 percentage point higher (⬆) than the previous report week.
Crude oil inputs to refineries increased (⬆) 307,000 barrels daily; there were 15.948 million barrels per day of crude oil run to facilities. Gross inputs, which include blending stocks, increased (⬆) 198,000 barrels daily to 16.315 million barrels daily.
Total petroleum product inventories decreased (⬇) by 0.8 million barrels from the previous report week, down to 780 million barrels.
Total product demand decreased (⬇) 127,000 barrels daily to 20.29 million barrels per day.
Gasoline stocks increased (⬆) 0.9 million barrels from the previous report week; total stocks are 228 million barrels.
Demand for gasoline increased (⬆) 179,000 barrels per day to 8.797 million barrels per day.
Distillate fuel oil stocks increased (⬆) 0.6 million barrels from the previous report week; distillate stocks are at 116.4 million barrels. EIA reported national distillate demand at 3.489 million barrels per day during the report week, a decrease (⬇) of 189,000 barrels daily.
Propane stocks rose (⬆) 2.2 million barrels from the previous report to 59.1 million barrels. The report estimated current demand at 821,000 barrels per day, a decrease (⬇) of 334,000 barrels daily from the previous report week.
Natural Gas
Spot natural gas futures moved higher last week. This reflected a lesser-than-expected build in underground inventories reported for the week ended May 3.
International events contributed to price strength. Egypt has bolstered controls at the Northern Sinai border with Israel. Diplomatic pressures on Israel have added a risk premium to natural gas prices.
A limiting factor can be found in European storage, where tanks are seen at 63.25% of capacity. This level, at the end of winter’s peak demand season, could limit further advances for now. If summer Cooling Degree Days develop with very hot weather, demand could draw stocks lower, reducing the current surplus.
Currently, supply stands 33% higher than the average of the past five years and more than 20% more than last year at this time.

The surplus in domestic supply does not yet show any indication of shrinkage. The IEA’s Gas Week shows dry natural gas production at 98.8 Bcf/d, 3.5% below last year at this time.
Producers of natural gas have cut back on drilling with prices currently at low levels. There are now only 102 natural gas drill rigs at work in the United States. This is a 2 ½ year low.
The effects of the Covid pandemic have distorted many data series. “Active rigs have fallen since climbing to a 4½ year high of 166 rigs in September 2022 from the pandemic-era record low of 68 rigs posted in July 2020 (data since 1987.)”
Price action has not yet provided the industry with actionable trading information. With summer upon us and a winter expected by weather experts to be significantly colder than 2023/2024, the outlook for higher prices seems to have the edge.
According to the EIA:
- Net injections into storage totaled 79 Bcf for the week ended May 3, compared with the five-year (2019–2023) average net injections of 81 Bcf and last year’s net injections of 71 Bcf during the same week. Working natural gas stocks totaled 2,563 Bcf, which is 640 Bcf (33%) more than the five-year average and 444 Bcf (21%) more than last year at this time.
- According to The Desk survey of natural gas analysts, estimates of the weekly net change to working natural gas stocks ranged from net injections of 69.2 Bcf to 107 Bcf, with a median estimate of 84 Bcf.
But, signs of economic weakness are emerging. They could dampen price advances ahead.
Was this memo helpful? We’d like your feedback.
Please respond to [email protected]
This material has been prepared by a sales or trading employee or agent of Powerhouse Brokers, LLC and is, or is in the nature of, a solicitation. This material is not a research report prepared by Powerhouse Brokers, LLC. By accepting this communication, you agree that you are an experienced user of the futures markets, capable of making independent trading decisions, and agree that you are not, and will not, rely solely on this communication in making trading decisions.
DISTRIBUTION IN SOME JURISDICTIONS MAY BE PROHIBITED OR RESTRICTED BY LAW. PERSONS IN POSSESSION OF THIS COMMUNICATION INDIRECTLY SHOULD INFORM THEMSELVES ABOUT AND OBSERVE ANY SUCH PROHIBITION OR RESTRICTIONS. TO THE EXTENT THAT YOU HAVE RECEIVED THIS COMMUNICATION INDIRECTLY AND SOLICITATIONS ARE PROHIBITED IN YOUR JURISDICTION WITHOUT REGISTRATION, THE MARKET COMMENTARY IN THIS COMMUNICATION SHOULD NOT BE CONSIDERED A SOLICITATION.
The risk of loss in trading futures and/or options is substantial and each investor and/or trader must consider whether this is a suitable investment. Past performance, whether actual or indicated by simulated historical tests of strategies, is not indicative of future results. Trading advice is based on information taken from trades and statistical services and other sources that Powerhouse Brokers, LLC believes are reliable. We do not guarantee that such information is accurate or complete and it should not be relied upon as such. Trading advice reflects our good faith judgment at a specific time and is subject to change without notice. There is no guarantee that the advice we give will result in profitable trades.
Copyright 2024 Powerhouse Brokers, LLC, All rights reserved


