

Diesel Demand Expectations May Change Due to China Trade Negotiations
- Diesel prices lower in recent weeks even in the face of tighter supply
- Tariff effects on domestic diesel demand shows up at U.S. ports
- Any progress in U.S. – China trade talks may change demand expectations rapidly
- Constrained oil prices may impact natural gas production
Sincerely,
David Thompson, CMT
Executive Vice President
Powerhouse
(202) 333-5380
The Matrix
In a free market, price is determined by the intersection of supply and demand. POWERHOUSE closely monitors U.S. diesel supply and has noted in numerous conversations how low domestic stocks have been since early February. Diesel inventories, both in outright barrels and days of supply have been hugging the low of the 5-year range for more than three months.
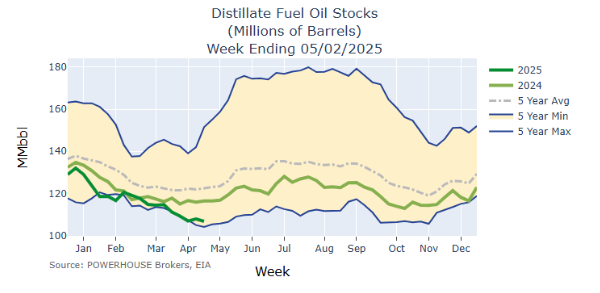
Yet during this same time period, the front-month futures contract has dropped more than 40 cents per gallon. A drop in diesel demand expectations over the same time plays a large role in explaining how price can decline even as supply remains tight.
The CEO of the port of Long Beach, CA said a week ago that, “We are at a point of inflection. It’s kind of dire. Less containers, less jobs, less business for truckers”. The ports of Los Angeles and Long Beach moved a combined 20 million containers last year and are showing a 44% year-over-year drop in docked vessels for the week of May 4th.
The announcement of a 90-day pause in the reciprocal tariffs with China that had reached as high as 145% is currently being taken by markets as a sign that the worst effects of a shutdown between the world’s two largest trading partners might be averted. Financial markets are forward-looking. Demand expectations can turn very quickly – recall Covid and the Russian invasion of Ukraine. Supply adjustments often take longer to appear.
If the market believes the ‘dire’ threats to diesel demand have been sidestepped then the focus may quickly turn to low diesel inventories. A sustained move above $2.20 in diesel futures prices will likely indicate that a more bullish sentiment has taken hold of the market.
Supply/Demand Balances
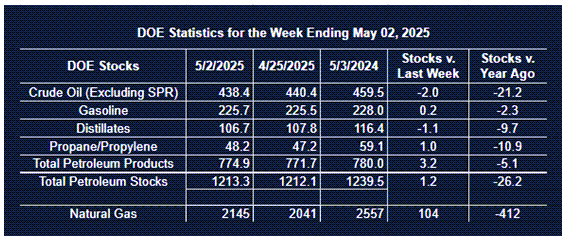
Supply/demand data in the United States for the week ended May 2, 2025, were released by the Energy Information Administration.
Total commercial stocks of petroleum increased (⬆) 1.2 million barrels to 1.213.3 billion barrels during the week ended May 2nd, 2025.
Commercial crude oil supplies in the United States were lower (⬇) by 2.0 million barrels from the previous report week to 438.4 million barrels.
Crude oil inventory changes by PAD District:
PADD 1: Up (⬆) 0.1 million barrels to 8.7 million barrels
PADD 2: Down (⬇) 0.1 million barrels to 108.3 million barrels
PADD 3: Down (⬇) 0.3 million barrels to 249.3 million barrels
PADD 4: Up (⬆) 0.2 million barrels to 24.6 million barrels
PADD 5: Down (⬇) 1.9 million barrels to 47.4 million barrels
Cushing, Oklahoma, inventories were down (⬇) 0.7 million barrels to 25.0 million barrels.
Domestic crude oil production decreased (⬇) 98,000 barrels per day from the previous report at 13.367 million barrels per day.
Crude oil imports averaged 6.056 million barrels per day, a daily increase (⬆) of 557,000 barrels. Exports decreased (⬇) 115,000 barrels daily to 4.006 million barrels per day.
Refineries used 89.0% of capacity; an increase (⬆) of 0.4% from the previous report week.
Crude oil inputs to refineries decreased (⬇) 7,000 barrels daily; there were 16.071 million barrels per day of crude oil run to facilities. Gross inputs, which include blending stocks, increased (⬆) 58,000 barrels daily to 16.384 million barrels daily.
Total petroleum product inventories decreased (⬇) by 3.2 million barrels from the previous report week, down to 774.9 million barrels.
Total product demand increased (⬆) 718,000 barrels daily to 19.872 million barrels per day.
Gasoline stocks increased (⬆) 0.2 million barrels from the previous report week; total stocks are 225.7 million barrels.
Demand for gasoline decreased (⬇) 381,000 barrels per day to 8.717 million barrels per day.
Distillate fuel oil stocks decreased (⬇) 1.1 million barrels from the previous report week; distillate stocks are at 106.7 million barrels. EIA reported national distillate demand at 3.521 million barrels per day during the report week, a decrease (⬇) of 29,000 barrels daily.
Propane stocks rose (⬆) 1.0 million barrels from the previous report to 48.2 million barrels. The report estimated current demand at 1,101,000 barrels per day, an increase (⬆) of 223,000 barrels daily from the previous report week.
Natural Gas
A quick sampling of Reuters natural gas headlines over the last few months reveals LNG exports feature in over 70% of article titles indicating how crucial U.S. exports are to futures prices.
Another factor to keep in mind is the interplay between crude oil prices and natural gas output. If OPEC+ continues to increase output, oil prices may remain constrained. This could cause U.S. shale drillers (with higher breakeven costs) to cut back. With 37% of U.S. gas production coming from associated gas according to federal data, a drop in rig rates will affect natural gas production.
According to the EIA:
- Net injections into storage totaled 104 Bcf for the week ended May 2, compared with the five-year (2020–24) average net injections of 79 Bcf and last year’s net injections of 81 Bcf during the same week. Working natural gas stocks totaled 2,145 Bcf, which is 30 Bcf (1%) more than the five-year average and 412 Bcf (16%) lower than last year at this time.
- According to The Desk survey of natural gas analysts, estimates of the weekly net change to working natural gas stocks ranged from net injections of 91 Bcf to 115 Bcf, with a median estimate of 100 Bcf.
Was this helpful? We’d like your feedback.
Please respond to [email protected]
This material has been prepared by a sales or trading employee or agent of Powerhouse Brokers, LLC and is, or is in the nature of, a solicitation. This material is not a research report prepared by Powerhouse Brokers, LLC. By accepting this communication, you agree that you are an experienced user of the futures markets, capable of making independent trading decisions, and agree that you are not, and will not, rely solely on this communication in making trading decisions.
DISTRIBUTION IN SOME JURISDICTIONS MAY BE PROHIBITED OR RESTRICTED BY LAW. PERSONS IN POSSESSION OF THIS COMMUNICATION INDIRECTLY SHOULD INFORM THEMSELVES ABOUT AND OBSERVE ANY SUCH PROHIBITION OR RESTRICTIONS. TO THE EXTENT THAT YOU HAVE RECEIVED THIS COMMUNICATION INDIRECTLY AND SOLICITATIONS ARE PROHIBITED IN YOUR JURISDICTION WITHOUT REGISTRATION, THE MARKET COMMENTARY IN THIS COMMUNICATION SHOULD NOT BE CONSIDERED A SOLICITATION.
The risk of loss in trading futures and/or options is substantial and each investor and/or trader must consider whether this is a suitable investment. Past performance, whether actual or indicated by simulated historical tests of strategies, is not indicative of future results. Trading advice is based on information taken from trades and statistical services and other sources that Powerhouse Brokers, LLC believes are reliable. We do not guarantee that such information is accurate or complete and it should not be relied upon as such. Trading advice reflects our good faith judgment at a specific time and is subject to change without notice. There is no guarantee that the advice we give will result in profitable trades.
Copyright 2025 Powerhouse Brokers, LLC, All rights reserved


