Trading Stats Send Complex Trend Signals
- Prices rose, open interest fell
- Supply-demand balance is tight
- LNG exports double

Alan Levine—Chairman, Powerhouse
(202) 333-5380

The Matrix
An obscure but striking development in the energy futures market has occurred over the last month. A technical statistic known as open interest has declined significantly.
As defined by the Chicago Mercantile Exchange (CME),
“Open interest is the total number of futures contracts held by market participants at the end of the trading day. It is used as an indicator to determine market sentiment and the strength behind price trends.
Unlike the total issued shares of a company, which typically remain constant, the number of outstanding futures contracts varies from day to day. Open interest and volume are related concepts, one key difference is that volume counts all contracts that have been traded, while open interest is a total of contracts that remain open in the market.
Traders can think of open interest as the cash flowing to the market. As open interest increases, more money is moving into the futures contract and as open interest declines money is moving out of the futures contract.”
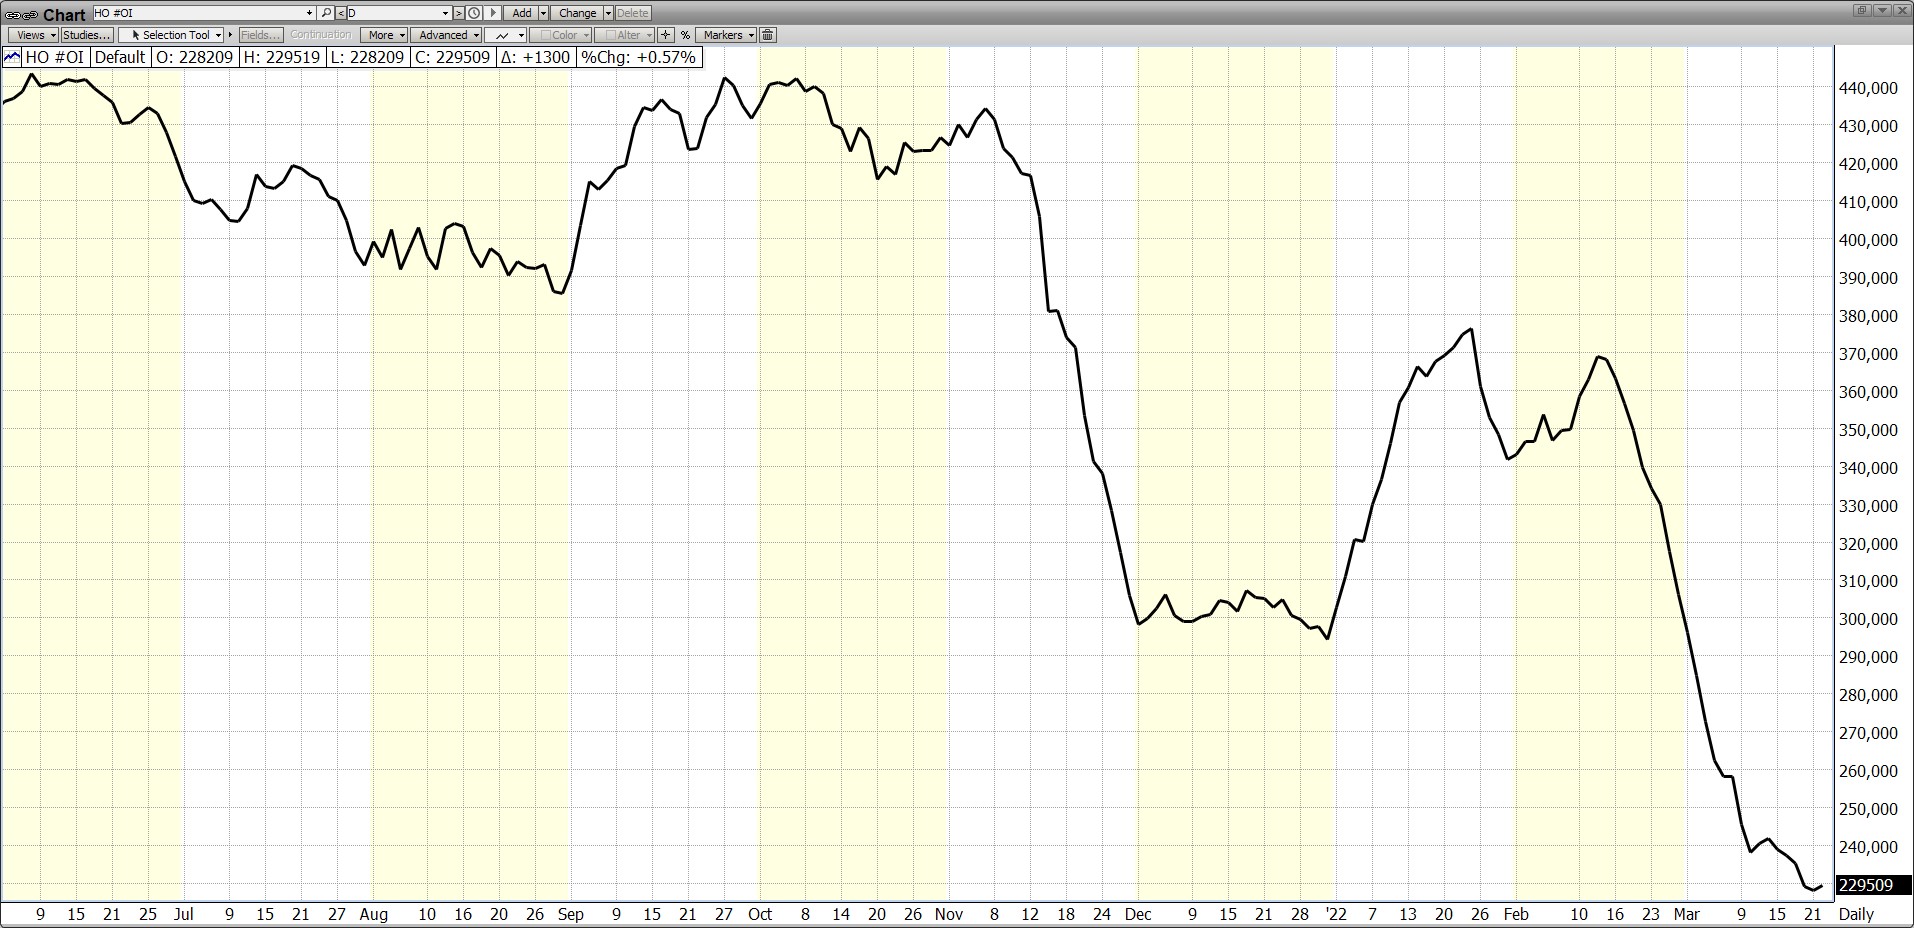
ULSD Open Interest June, 2021 – March, 2022 Source: CME
Analyzing open interest can give market participants valuable insight into market sentiment. Typically, (emphasis on typically) increasing open interest acts as a confirmation of the existing price trend whereas decreasing open interest may indicate that the trend is starting to weaken.
Between February 15 and March 16, the ULSD futures market has seen truly historic price action. The biggest one day move up AND down in price as well as an all-time high intraday price. Focusing only on the closing prices from the start to the end of that period, the market rose approximately 24 cents/gallon. Rising price with dramatically falling open interest. Omens of a weakening trend?
No single statistic or indicator or news event is the sole driver of market prices. The drop in open interest in ULSD futures occurred as volatility ramped up dramatically and the Exchanges raised initial margin requirements (the good faith deposit necessary to hold a futures contract) forcing many speculators and those without deep financial pockets to the sidelines. Fewer market participants caused bid/ask spreads to widen meaning each geopolitical headline had a greater effect on price.
The implications of this unusual situation have yet to be fully played out. Beyond internal technical dynamics of the futures market, physical diesel inventories remain tight and crude oil production remains throttled. Concerns of a broader economic slowdown remain on the horizon at present.
Stay in touch with POWERHOUSE. We diligently monitor open interest changes. A return of money into the futures market will be a market moving development.
Supply/Demand Balances
Supply/demand data in the United States for the week ended March 11, 2022, were released by the Energy Information Administration.
Total commercial stocks of petroleum fell 3.6 million barrels during the week ended March 11, 2022.
Commercial crude oil supplies in the United States increased by 4.3 million barrels from the previous report week to 415.9 million barrels.
Crude oil inventory changes by PAD District:
PADD 1: Down 0.1 million barrels to 7.5 million barrels
PADD 2: Plus 0.2 million barrels to 101.0 million barrels
PADD 3: Plus 5.3 million barrels to 234.6 million barrels
PADD 4: Plus 0.2 million barrels to 23.7 million barrels
PADD 5: Down 1.3 million barrels to 491 million barrels
Cushing, Oklahoma, inventories were plus 1.8 million barrels from the previous report week to 24 million barrels.
Domestic crude oil production was unchanged from the previous report week at 11.6 million barrels daily.
Crude oil imports averaged 6.395 million barrels per day, a daily increase of 76,000 barrels. Exports increased 514,000 barrels daily to 2.936 million barrels per day.
Refineries used 90.4% of capacity; 1.1 percentage points higher from the previous report week.
Crude oil inputs to refineries increased 224,000 barrels daily; there were 15.601 million barrels per day of crude oil run to facilities. Gross inputs, which include blending stocks, rose 192,000 barrels daily to 16.159 million barrels daily.
Total petroleum product inventories fell 7.9 million barrels from the previous report week.
Gasoline stocks decreased 3.6 million barrels from the previous report week; total stocks are 241 million barrels.
Demand for gasoline slipped by 19,000 barrels per day to 8.944 million barrels per day.
Total product demand decreased 558,000 barrels daily to 20.652 million barrels per day.
Distillate fuel oil stocks increased 0.3 million barrels from the previous report week; distillate stocks are at 114.2 million barrels. EIA reported national distillate demand at 3.704 million barrels per day during the report week, a decrease of 883,000 barrels daily.
Propane stocks decreased 2.2 million barrels from the previous report week; propane stocks are at 33.3 million barrels. The report estimated current demand at 1.532 million barrels per day, an increase of 344,000 barrels daily from the previous report week.
Natural Gas
Powerhouse has been commenting on the dramatic growth in U.S. LNG exports in the past several months. Last week, EIA confirmed this trend; LNG exports set a record high in 2021. They expanded by 50% over the year before, 2020.
Exports reached 9.7 Bcf/d last year, a gain of 3.2 Bcf/d. Growth was attributed to demand expansion in Europe and Asia. And in Asia, notably China. Moreover, U.S. supply capacity grew too. The six U.S. export terminals averaged 102% of “nameplate” capacity.
Exports of LNG to Asia increased 51% year-on-year, making the U.S. the third largest supplier to the region. This country now provides 12% of Asian LNG imports. Australia and Qatar provided the largest amounts of supply, 29% and 21% respectively.
European imports from the U.S. grew 32% last year. The Netherlands and France, followed by Turkey and the U.K. were the largest importers.
Brazil, notable among overseas markets, expanded its take too. Brazil faced its worst drought in over 90 years. The country turned to U.S. LNG to replace failing hydroelectric power supply.
According to the EIA:
The net withdrawals from storage totaled 79 Bcf for the week ending March 11, compared with the five-year (2017–2021) average net withdrawals of 65 Bcf and last year’s net withdrawals of 16 Bcf during the same week. Working natural gas stocks totaled 1,440 Bcf, which is 304 Bcf lower than the five-year average and 344 Bcf lower than last year at this time.
According to The Desk survey of natural gas analysts, estimates of the weekly net change to working natural gas stocks ranged from net withdrawals of 56 Bcf to 87 Bcf, with a median estimate of 73 Bcf.
The average rate of withdrawals from storage is 10% higher than the five-year average at this point in the withdrawal season (November through March). If the rate of withdrawals from storage matched the five-year average of 3.9 Bcf/d for the remainder of the withdrawal season, the total inventory would be 1,362 Bcf on March 31, which is 304 Bcf lower than the five-year average of 1,666 Bcf for that time of year.
Was this helpful? We’d like your feedback.
Please respond to [email protected]
Powerhouse Futures & Trading Disclaimer
Copyright 2021 Powerhouse Brokerage, LLC, All rights reserved