Bearish Expectations, Bullish Possibilities
- U.S. oil production approaching 11 million barrels daily
- U.S. refining used nearly 96% of capacity
- Venezuelan output of crude oil and products falling
- Natural gas futures moved over $3.00

The Matrix
Bearish stories are dominating the petroleum press: U.S. crude oil production approaching eleven million barrels daily, OPEC and Russia planning to increase supply; an OPEC meeting in the offing, scheduled to determine any increase; Trump administration asking for more OPEC crude oil, Trump administration threating a Trade War. As the week of June 15 ended, WTI crude oil held $65, but a break of support at $64.20 is well within range.
ULSD presents a more definitively bearish picture. Spot futures fell around seven cents on Friday, breaking support at $2.1160. Next support is found at $2.0560.
RBOB followed suite, but with far less intensity. The product is now out of season. Powerhouse expects prices to soften through summer, unless some natural event like a Gulf-of-Mexico hurricane occurs. Currently, the National Weather Service puts the likelihood of a Gulf weather event at less than ten per cent.
Product weakness has eaten into gas crack spread values. From Memorial Day highs, RBOB cracks, basis August, have fallen around $4.75 in the subsequent two weeks. They closed on June 15 at $19.90. Winter ULSD crack spreads, basis December have resisted the downside, falling only $3.26 during this time.
Less emphasized have been events with the power to cut into global supplies moving prices higher. These include steady gains in global demand, risks to production in Libya and Venezuela and expanded uses for middle distillates.
The direction of trade for petroleum has shifted outward in the United States. Exports have been taking an expanding share of supply. Crude oil exports now exceed two million barrels daily. And distillate fuel oil outflow has run in excess of one million barrels daily for some time.
Growing U.S. production has come on stream at a particularly fortuitous time. Venezuela, once a major supplier of petroleum has been losing output because of a congeries of causes. These include poor maintenance of facilities reflecting spare part shortages, loss of skilled workers and general mismanagement. Recent estimates project Venezuelan refineries operating at 36 per cent of capacity.
Taken together, analysts are expressing concern that further declines in output could lead to a global petroleum shortfall.
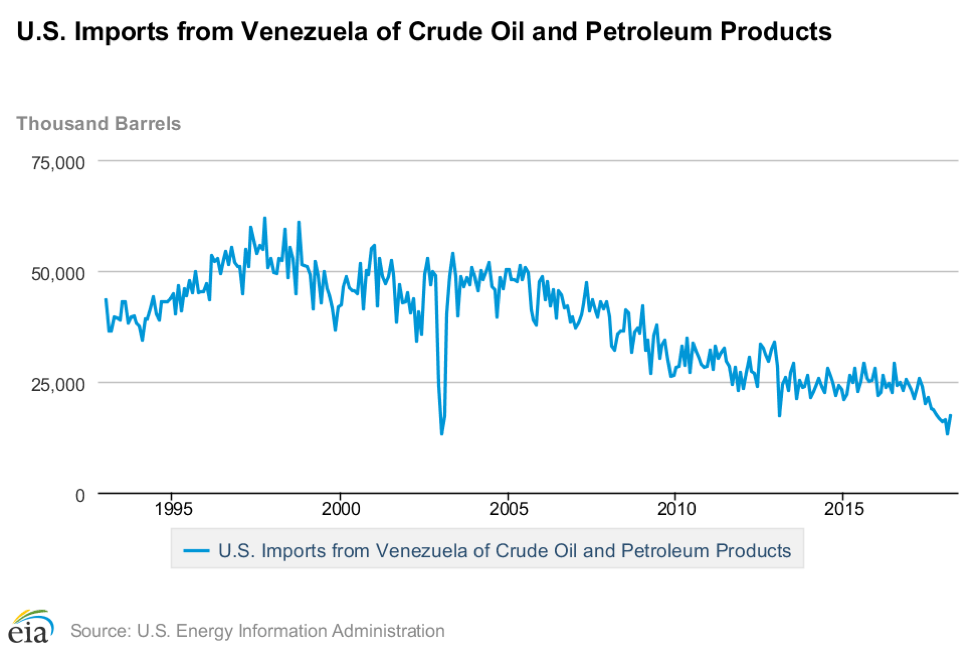
Crude and Petroleum Products: Weekly Imports 1993 – 2018 Source: EIA
Supply/Demand Balances
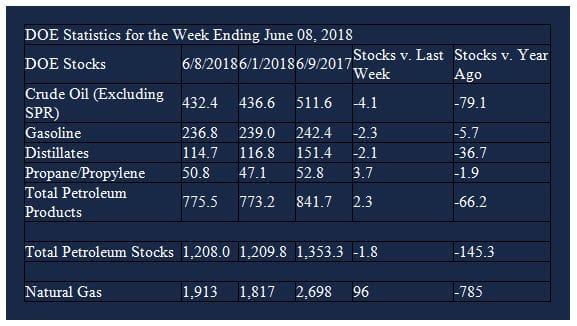
Supply/demand data in the United States for the week ending June 8, 2018 were released by the Energy Information Administration.
Total commercial stocks of petroleum fell 1.8 million barrels during the week ending June 8, 2018.
There were draws in stocks of gasoline, distillate fuel oil, and residual fuel. There were builds in stocks of fuel ethanol, K-jet fuel, propane, and other oils.
Commercial crude oil supplies in the United States decreased to 432.4 million barrels, a draw of 4.1 million barrels.
Crude oil supplies decreased in four of the five PAD Districts. PAD District 1 (East Coast) crude oil stocks fell 0.5 million barrels, PADD 2 (Midwest) stocks declined 2.5 million barrels, PADD 3 (Gulf Coast) crude oil decreased 1.0 million barrels, and PADD 4 (Rockies) stocks fell 0.1 million barrels. PAD District 5 (West Coast) stocks were unchanged from the previous report week.
Cushing, Oklahoma inventories decreased 0.7 million barrels from the previous report week to 33.9 million barrels.
Domestic crude oil production increased 100,000 barrels daily to 10.900 million barrels per day from the previous report week.
Crude oil imports averaged 8.099 million barrels per day, a daily decrease of 247,000 barrels per day. Exports increased 316,000 barrels daily to 2.030 million barrels per day.
Refineries used 95.7 per cent of capacity, an increase of 0.3 percentage points from the previous report week.
Crude oil inputs to refineries increased 136,000 barrels daily; there were 17.505 million barrels per day of crude oil run to facilities. Gross inputs, which include blending stocks, rose 91,000 barrels daily to 17.798 million barrels daily.
Total petroleum product inventories saw an increase of 2.3 million barrels from the previous report week.
Gasoline stocks fell 2.3 million barrels from the previous report week; total stocks are 236.8 million barrels.
Demand for gasoline rose 903,000 barrels per day to 9.879 million barrels per day.
Total product demand increased 3.346 million barrels daily to 21.801 million barrels per day.
Distillate fuel oil supply decreased 2.1 million barrels from the previous report week to 114.7 million barrels. National distillate demand was reported at 4.404 million barrels per day during the report week. This was a weekly increase of 902,000 barrels daily.
Propane stocks rose 3.7 million barrels from the previous report week; propane stock are 50.8 million barrels. Current demand is estimated at 144,000 barrels per day, an increase of 144,000 barrels daily from the previous report week.
Natural Gas
According to the Energy Information Administration:
Net injections rose higher than the five-year average. Net injections into storage totaled 96 Bcf for the week ending June 8, compared with the five-year (2013–17) average net injection of 91 Bcf and last year’s net injections of 82 Bcf during the same week.
Net injections averaged 13.7 Bcf/d. Net injections will have to average 12.6 Bcf/d for the remainder of the refill season to match the five-year average level (3,815 Bcf) by October 31. Working gas stocks totaled 1,913 Bcf, which is 507 Bcf lower than the five-year average and 785 Bcf lower than last year at this time.
Natural gas spot futures prices pierced $3.00 as the week of June 15 ended. Analysts considering recent market activity are cautious about declaring a rally in place. Some are looking for a strip of several months above $3.00 as a minimum condition to get long.
Futures trading involves significant risk and is not suitable for everyone. Transactions in securities futures, commodity and index futures and options on future markets carry a high degree of risk. The amount of initial margin is small relative to the value of the futures contract, meaning that transactions are heavily “leveraged”. A relatively small market movement will have a proportionately larger impact on the funds you have deposited or will have to deposit: this may work against you as well as for you. You may sustain a total loss of initial margin funds and any additional funds deposited with the clearing firm to maintain your position. If the market moves against your position or margin levels are increased, you may be called upon to pay substantial additional funds on short notice to maintain your position. If you fail to comply with a request for additional funds within the time prescribed, your position may be liquidated at a loss and you will be liable for any resulting deficit. Past performance may not be indicative of future results. This is not an offer to invest in any investment program.
Powerhouse is a registered affiliate of Coquest, Inc.
Was this helpful? We’d like your feedback.
Please respond to [email protected]
Copyright © 2018 Powerhouse, All rights reserved.