The Economy Will Contract–But When?
- Jobs are strong and supporting the economy
- Inflation and higher interest rates are on the horizon
- Technological gains have helped only marginally in oil prices
- Natural gas prices face a reduction
Sincerely,
Alan Levine, Chairman
Powerhouse
(202) 333-5380

The Matrix
The prospect of a recession is not something oilmen relish. Bullish signs for the economy include a strong jobs market and a reported $2 trillion excess cash held by households. But reports of US inflation reaching a 40-year high with its implications for killing demand cannot be ignored.
Inflation has become the go-to topic of most discussions of the economy. Price growth raises the likelihood of even further Fed rate hikes. Demand destruction should not be far behind.
Economists are adept at kicking the can down the road. They concede a contraction is in the cards, but unlikely in the immediate future (citing jobs and free cash with consumers.) One is reminded of the great mid-20th century thinker, Kenneth Boulding, who said, “Anyone who believes exponential growth can go on forever in a finite world is either a madman or an economist.”
As business people, we should already be planning for a time of contraction. A recession could mean the loss of perhaps hundreds of thousands of jobs. Financial markets could also experience further erosion. (The Nasdaq composite stock index has already achieved bear market status.) The impact on demand for oil and energy should inevitably become bearish.
Technology has altered the impact of price on personal incomes. For many items, higher prices have been more than matched by income gains. Not so for many refined products.
The chart below, from US government sources, shows gasoline and fuel oil are taking a larger share of disposable income now versus January 1998. Matrix
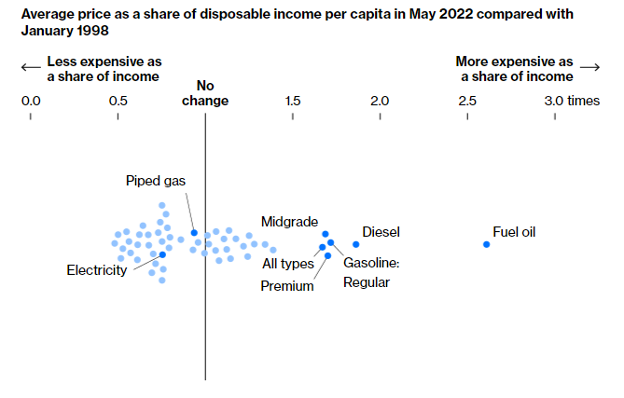
Prices as Share of Disposable Income May 2022 compared to January 1998 Source: US Bureau of Labor Statistics; US Bureau of Economic Analysis
Improvements in technology, generally cost-efficient, have not been enough to overcome supply problems developed in recent years as lower refinery investment has cut into domestic ability to supply petroleum products to market.
Supply/Demand Balances
Supply/demand data in the United States for the week ended June 3, 2022, were released by the Energy Information Administration.
Total commercial stocks of petroleum grew 11 million barrels during the week ended June 3, 2022.
Commercial crude oil supplies in the United States increased by 2.0 million barrels from the previous report week to 416.8 million barrels.
Crude oil inventory changes by PAD District:
PADD 1: Minus 1.9 million barrels to 7.4 million barrels
PADD 2: Minus 1.2 million barrels to 103.8 million barrels
PADD 3: Plus 8.0 million barrels to 235.4 million barrels
PADD 4: Plus 0.2 million barrels to 25.0 million barrels
PADD 5: Down 3.0 million barrels to 45.1 million barrels
Cushing, Oklahoma, inventories were down 1.6 million barrels from the previous report week to 25.0 million barrels.
Domestic crude oil production was unchanged from the previous report week at 11.9 million barrels daily.
Crude oil imports averaged 6.154 million barrels per day, a daily decrease of 64,000 barrels. Exports decreased 1.758 million barrels daily to 2.232 million barrels per day.
Refineries used 94.2% of capacity; 1.6 percentage points more than the previous report week.
Crude oil inputs to refineries increased 354,000 barrels daily; there were 16.387 million barrels per day of crude oil run to facilities. Gross inputs, which include blending stocks, rose 287,000 barrels daily to 16.904 million barrels daily.
Total petroleum product inventories added 8.4 million barrels from the previous report week, rising to 748.4 million barrels.
Total product demand increased 714,000 thousand barrels daily to 20.227 million barrels per day.
Gasoline stocks decreased 0.8 million barrels from the previous report week; total stocks are 218.2 million barrels.
Demand for gasoline grew 222,000 barrels per day to 9.199 million barrels per day.
Distillate fuel oil stocks increased 2.6 million barrels from the previous report week; distillate stocks are at 109.0 million barrels. EIA reported national distillate demand at 3.650 million barrels per day during the report week, a decrease of 319,000 barrels daily.
Propane stocks increased 4.2 million barrels from the previous report week; propane stocks are at 50.2 million barrels. The report estimated current demand at 1.366 million barrels per day, an increase of 746,000 barrels daily from the previous report week.
Natural Gas
The seasonal peak for natural gas prices often comes in December. Markets are many months away from that, and fundamental data support the prospect of further advances. DOE’s Weekly Natural Gas Update for the week ended June 9, 2022, reported falling production in the Permian Basin particularly in New Mexico.
Total domestic demand increased 1.8% over the week, reflecting higher Cooling Degree Days in the Midwest and Middle Atlantic states. Power generation rose 6.9% nationally as air conditioning needs kicked in. The report week saw 18 CDDs more than last year at this time.
Charts of spot futures prices, nonetheless, may be ready to set back. Prices struggled to make new highs last week, reaching $9.664. At the same time, technical analyses like the Relative Strength Index (RSI) have diverged suggesting a retracement could be coming. The RSI measures the momentum of closing prices (either up or down) over a given period of time. Bearish divergence occurs when price makes a higher high, but the RSI fails to follow suit and instead makes a lower relative high.
A retracement to $6.26 is possible. Technicians see an upside of $13.00 after such a setback.
According to the EIA:
Net injections [of natural gas] into storage totaled 97 Bcf for the week ended June 3, compared with the five-year (2017–2021) average net injections of 100 Bcf and last year’s net injections of 98 Bcf during the same week. Working natural gas stocks totaled 1,999 Bcf, which is 340 Bcf lower than the five-year average and 398 Bcf lower than last year at this time.
The average rate of injections into storage is 9% lower than the five-year average so far in the refill season (April through October). If the rate of injections into storage matched the five-year average of 8.7 Bcf/d for the remainder of the refill season, the total inventory would be 3,305 Bcf on October 31, which is 340 Bcf lower than the five-year average of 3,645 Bcf for that time of year.
Was this helpful? We’d like your feedback.
Please respond to [email protected]
Powerhouse Futures & Trading Disclaimer
Copyright 2022 Powerhouse Brokerage, LLC, All rights reserved