Looking For Clues
- Petroleum product prices are consolidating
- Backwardation is a bullish signal
- U.S. weather forecasts supportive for natural gas prices
Sincerely,
Elaine Levin, President (filling in for Alan Levine)
Powerhouse
(202) 333-5380
The Matrix
The selloff in petroleum prices that began in June has stalled, at least for now. From the June highs, ULSD futures fell $1.29 per gallon, and RBOB futures lost $1.22 per gallon, a decline of around 28% for both contracts. Prices have started to consolidate. As we look ahead to the second part of the year, buyers must weigh the risk of historically low inventories against global recession fears. The relationship between the futures delivery months is one clue to watch for direction.
In a perfect world, the price difference between the delivery months of petroleum futures should reflect the cost of money and the cost of storage. But the world is not perfect. Prices also reflect the current supply and demand dynamics. The futures curve for ULSD and RBOB are currently backwardated, meaning the price of the nearby future is the most expensive and prices get cheaper as the delivery month moves out in time. Backwardation occurs when the market is worried about short-term supply. Buyers are willing to pay up to own product right now.
Backwardation is a bullish price signal. Many wrongly believe traders are actively pushing prices down out the price curve because they believe the price will be cheaper in the future. In reality, the nearby futures have most of the volume and drive the price action. Backwardation also discourages the building of inventory. Product bought today is valued less in the future, which make storage unattractive.
Distillate inventory has slowly been rising but remain below the five-year range. The backwardation has also been falling. In April, the difference between the first and second nearby ULSD futures hit a record $1.68 per gallon. That difference is now under $0.06, and improvement over earlier this year, but still historically wide. Any flattening of the curve would signal falling demand or improving supply.
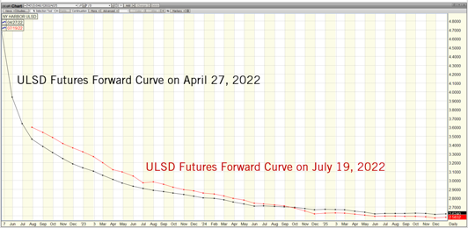
ULSD Futures Forward Price Curves April vs July 2022 Source: FutureSource, POWERHOUSE
RBOB inventories also are tight, particularly in PADD1, the delivery point for the NYMEX futures. At writing, the price of the August futures is $0.1350 more expensive than the September futures. Backwardation this steep usually is only seen with the grade change to the winter specification (which starts with the October futures contract).
Until the price curves shift, a rally in prices this fall cannot be ruled out.
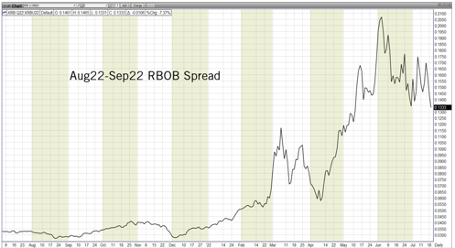
RBOB Futures Aug22-Sep22 Spread Prices Aug 2021 to July 2022 Source: FutureSource, POWERHOUSE
Supply/Demand Balances
Supply/demand data in the United States for the week ended July 08, 2022, were released by the Energy Information Administration.
Total commercial stocks of petroleum grew 21.7 million barrels during the week ended July 08, 2022.
Commercial crude oil supplies in the United States increased by 3.3 million barrels from the previous report week to 427.1 million barrels.
Crude oil inventory changes by PAD District:
PADD 1: Down 1.1 million barrels to 6.9 million barrels
PADD 2: Plus 0.1 million barrels to 103.3 million barrels
PADD 3: Plus 1.8 million barrels to 243.5 million barrels
PADD 4: Down 0.1 million barrels to 23.7 million barrels
PADD 5: Down 0.1 million barrels to 47.1 million barrels
Cushing, Oklahoma, inventories were up 0.3 million barrels from the previous report week to 21.6 million barrels.
Domestic crude oil production was down 100,000 barrels from the previous report week to 12 million barrels daily.
Crude oil imports averaged 6.675 million barrels per day, a daily decrease of 164,000 barrels. Exports increased 412,000 barrels daily to 3.024 million barrels per day.
Refineries used 94.9% of capacity; 0.4 percentage points higher than the previous report week.
Crude oil inputs to refineries increased 202,000 barrels daily; there were 16.640 million barrels per day of crude oil run to facilities. Gross inputs, which include blending stocks, rose 65,000 barrels daily to 17.023 million barrels daily.
Total petroleum product inventories rose by 18.4 million barrels from the previous report week, rising to 780.4 million barrels.
Total product demand decreased 1.744 million barrels daily to 18.720 million barrels per day.
Gasoline stocks increased 5.8 million barrels from the previous report week; total stocks are 224.9 million barrels.
Demand for gasoline fell 1,351,000 barrels per day to 8.062 million barrels per day.
Distillate fuel oil stocks increased 2.7 million barrels from the previous report week; distillate stocks are at 113.8 million barrels. EIA reported national distillate demand at 3.368 million barrels per day during the report week, a decrease of 1,014,000 barrels daily.
Propane stocks were up 2.9 million barrels from the previous report week to 57.8 million barrels. The report estimated current demand at 0.557 million barrels per day, a decrease of 32,000 barrels daily from the previous report week.
Natural Gas
U.S. weather forecasts are calling for hotter for longer across most of the country. Price is reacting bullishly. Front month natural gas futures are testing $7.50, a 50% retracement of the sell-off in price on the Freeport LNG closure news. Next resistance is at $8.
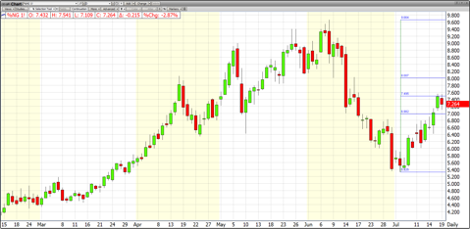
NG Price Resistance Feb 2022 to July 2022 Source: FutureSource, POWERHOUSEAccording to the EIA:
Working gas in storage was 2,369 Bcf as of Friday, July 8, 2022, according to EIA estimates. This represents a net increase of 58 Bcf from the previous week. Stocks were 252 Bcf less than last year at this time and 319 Bcf below the five-year average of 2,688 Bcf. At 2,369 Bcf, total working gas is within the five-year historical range.
Was this helpful? We’d like your feedback.
Please respond to [email protected]
Powerhouse Futures & Trading Disclaimer
Copyright 2022 Powerhouse Brokerage, LLC, All rights reserved