Immovable Object Meets Irresistible Force
- Crude oil futures price curve shifted to backwardation
- Futures market and physical markets don’t always agree
- Analyzing changes in the futures curve can provide information
- Natural gas demand is shifting.
Sincerely
Al Levine, Chair
Powerhouse
(202) 333-5380

The Matrix
Futures markets provide lots of information about price expectations that may be missed because generally reported information tends to focus on price activity in the cash market and the nearby futures price. Hedgers understand that price information for a particular commodity is available for months into the future. The pattern of prices of commodity futures contracts from the front month through a more distant month is known as the futures curve. This extended
futures curve, and specifically changes in the shape of the curve can provide valuable information.
For a physically storable commodity, it is normal for deferred contract months to be higher in price than the prompt month. This reflects the cost of storing the commodity in question. This condition is known as carry or contango. If market participants believe a shortage of the
commodity may develop, then it is possible for the prompt month’s price to exceed that of more distant months in a condition known as backwardation. A useful mnemonic is to remember that backwardation is bullish – they both begin with the letter B.
The chart below shows the state of the WTI crude oil futures curves in two different time frames. The orange line shows the curve as of January 2, 2024. The gold line shows the current curve (as of June 28, 2024). The change in the shape of the gold curve shows the market moving from modest carry into significant backwardation. And the market has been bullish over this period.
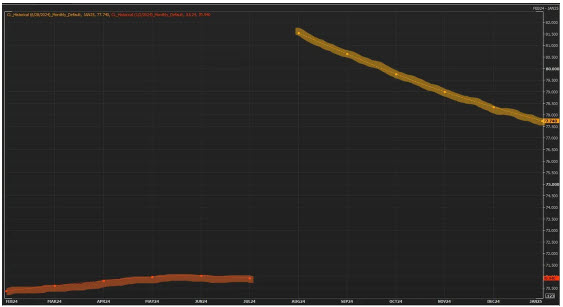
Source: LSEG
What makes this development interesting and challenging is that it has occurred as crude oil inventories have been increasing, running counter to a seasonal pattern of inventory depletions at this time of year. Analysts place this build-up primarily along the Gulf Coast where crude oil stocks have now reached the highest level since the COVID economic shut-down.
Clearly, financial market participants are anticipating a reversal of this trend. Should we see a reduction in backwardation, that could be a key early warning signal that the bullish sentiment is
starting to fade. The futures curves often provide information like this in the absence of any clear fundamental data points.
Supply/Demand Balances
Supply/demand data in the United States for the week ended June 14, 2024, were released by the Energy Information Administration.
Total commercial stocks of petroleum increased (⬆) 8.2 million barrels to 1.296 billion barrels during the week ended June 21, 2024.
Commercial crude oil supplies in the United States were higher (⬆) by 3.6 million barrels from the previous report week to 460.7 million barrels.
Crude oil inventory changes by PAD District:
PADD 1: Down (⬇) 0.3 million barrels to 8.1 million barrels
PADD 2: Down (⬇) 1 million barrels to 116.3 million barrels
PADD 3: Up (⬆) 2 million barrels to 264.3 million barrels
PADD 4: Down (⬇) 0.2 million barrels to 24 million barrels
PADD 5: Up (⬆) 2.8 million barrels to 47.9 million barrels
Cushing, Oklahoma, inventories were down (⬇) 0.2 million barrels to 33.9 million barrels.
Domestic crude oil production remained unchanged at 13.2 million barrels per day.
Crude oil imports averaged 6.611 million barrels per day, a daily decrease (⬇) of 443,000 barrels. Exports decreased (⬇) 508,000 barrels daily to 3.910 million barrels per day.
Refineries used 92.2% of capacity; 1.3 percentage point lower (⬇) than the previous report week.
Crude oil inputs to refineries decreased (⬇) 233,000 barrels daily; there were 16.532 million barrels per day of crude oil run to facilities. Gross inputs, which include blending stocks, decreased (⬇) 248,000 barrels daily to 16.895 million barrels daily.
Total petroleum product inventories increased (⬆) by 4.5 million barrels from the previous report week, up to 835.3 million barrels.
Total product demand decreased (⬇) 392,000 barrels daily to 20.689 million barrels per day.
Gasoline stocks increased (⬆) 2.7 million barrels from the previous report week; total stocks are 233.9 million barrels.
Demand for gasoline decreased (⬇) 417,000 barrels per day to 8.969 million barrels per day.
Distillate fuel oil stocks decreased (⬇) 0.4 million barrels from the previous report week; distillate stocks are at 121.3 million barrels. EIA reported national distillate demand at 3.536 million barrels per day during the report week, an decrease (⬇) of 441,000 barrels daily.
Propane stocks rose (⬆) 2.1 million barrels from the previous report to 73.5 million barrels. The report estimated current demand at 1,027,000 barrels per day, a increase (⬆) of 315,000 barrels daily from the previous report week.
Natural Gas
Natural gas was a lighting source in the United States throughout the 19th century. Its market expanded with the invention of the Bunsen burner in 1885. Natural gas has moved well beyond
commonplace uses like providing home heating and cooking to become more critical in an environmentally conscious world. In 2005, coal generated roughly half of the nation’s electricity. By 2020, that share was down to 19%, largely due to the replacement of coal-fired generation with generation from gas-powered units.
The latest seismic shift in the natural gas industry has come because of the dramatic increase in U.S. LNG export capacity. In a research report from earlier this year, the Center for Strategic &
International Studies notes that in 2023, total U.S. gas exports likely totaled 7.5 tcf which exceeds consumption by either the domestic commercial or residential sectors. With another 3 tcf in export capacity currently under construction and more awaiting authorization, exports in the future could become the single largest destination for domestic production.
Global demand for US LNG should alter historical price patterns at Henry Hub. Commercial and industrial power demands in Europe and Asia will increasingly affect U.S. prices independent of weather. Regarding weather, with U.S. LNG now increasingly a supply balancer, market participants will have to pay attention to global forecasts too.

According to the EIA:
- Net injections into storage totaled 74 Bcf for the week ended June 7, compared with the five-year (2019–2023) average net injections of 89 Bcf and last year’s net injections of 90 Bcf during the same week. Working natural gas stocks totaled 2,974 Bcf, which is 573 Bcf (24%) more than the five-year average and 364 Bcf (14%) more than last year at this time.
- According to The Desk survey of natural gas analysts, estimates of the weekly net change to working natural gas stocks ranged from net injections of 60 Bcf to 83 Bcf, with a median estimate of 72 Bcf.
- The average rate of injections into storage is 8% lower than the five-year average so far in the refill season (April through October). If the rate of injections into storage matched the five-year average of 9.0 Bcf/d for the remainder of the refill season, the total inventory would be 4,285 Bcf on October 31, which is 573 Bcf higher than the five-year average of 3,712 Bcf for that time of year.
Was this helpful? We’d like your feedback.
Please respond to [email protected]
This material has been prepared by a sales or trading employee or agent of Powerhouse Brokers, LLC and is, or is in the nature of, a solicitation. This material is not a research report prepared by Powerhouse Brokers, LLC. By accepting this communication, you agree that you are an experienced user of the futures markets, capable of making independent trading decisions, and agree that you are not, and will not, rely solely on this communication in making trading decisions.
DISTRIBUTION IN SOME JURISDICTIONS MAY BE PROHIBITED OR RESTRICTED BY LAW. PERSONS IN POSSESSION OF THIS COMMUNICATION INDIRECTLY SHOULD INFORM THEMSELVES ABOUT AND OBSERVE ANY SUCH PROHIBITION OR RESTRICTIONS. TO THE EXTENT THAT YOU HAVE RECEIVED THIS COMMUNICATION INDIRECTLY AND SOLICITATIONS ARE PROHIBITED IN YOUR JURISDICTION WITHOUT REGISTRATION, THE MARKET COMMENTARY IN THIS COMMUNICATION SHOULD NOT BE CONSIDERED A SOLICITATION.
The risk of loss in trading futures and/or options is substantial and each investor and/or trader must consider whether this is a suitable investment. Past performance, whether actual or indicated by simulated historical tests of strategies, is not indicative of future results. Trading advice is based on information taken from trades and statistical services and other sources that Powerhouse Brokers, LLC believes are reliable. We do not guarantee that such information is accurate or complete and it should not be relied upon as such. Trading advice reflects our good faith judgment at a specific time and is subject to change without notice. There is no guarantee that the advice we give will result in profitable trades.
Copyright 2024 Powerhouse Brokers, LLC, All rights reserved