Bearish Outlook Overwhelms Crude Prices
- Crude prices lose nearly $32 since October
- U.S. shale producers cut drilling plans for 2019
- Iranian sanction waivers extend to Iraq
- Short supply increased natural gas volatility

The Matrix
Oil prices have moved steadily lower since early October. The reasons for bullish optimism that had sustained a long rally started to be topped by the reality of U.S. crude oil production growth and rising concerns over the prospects for continuing global economic growth. Iranian sanctions were expected to take over one million barrels daily from global balances. Venezuela and Libya faced challenges to maintaining output. OPEC and Russia considered cutting new crude oil supply to support prices.
The three months since then have seen crude oil futures prices lose about $31.75. Product prices eroded as well. ULSD futures lost nearly 75 cents and RBOB fell more than 85 cents. In the week ending December 21 alone, WTI crude oil futures fell six dollars. ULSD gave up thirteen cents and RBOB ceded fourteen cents per gallon. Producer reactions have been strong. Domestic U.S. shale producers have collectively announced reduced plans for new drilling. This would be a significant shock to an industry that experienced 2018 output growth to nearly eleven million barrels daily, bringing U.S. crude oil output higher than both Saudi Arabia and Russia.
The bullish implications of Iranian sanctions have been offset by a series of waivers conceded to allow Iran to export crude oil to India and China. A waiver granted to Iraq, allowing import of Iranian natural gas and electricity has not been widely reported. This exception will permit Iraq to produce power to overcome electric shortages in southern Iraq.
The U.S. government has been shut down. It is hard to determine what the effect of this might be on petroleum availability and pricing, especially with respect to foreign trade’s import and export of crude oil. Indeed, any activity that involves inspection or other regulatory oversight might be inhibited by the reduction in government staff.
Supply/Demand Balances
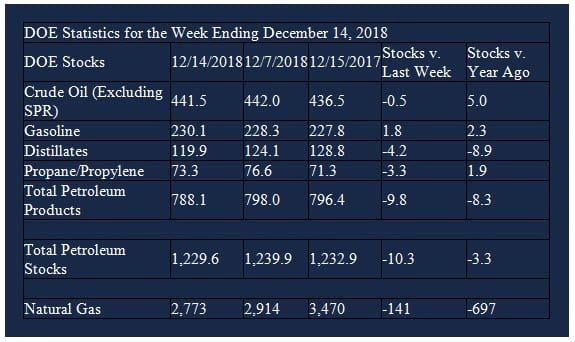
Supply/demand data in the United States for the week ending December 14, 2018 were released by the Energy Information Administration.
Total commercial stocks of petroleum decreased 10.3 million barrels during the week ending December 14, 2018.
There were draws in stocks of distillate fuel oil, residual fuel oil, propane, and other oils. Builds were reported in stocks of gasoline, fuel ethanol, and K-jet fuel.
Commercial crude oil supplies in the United States decreased to 441.5 million barrels, a draw of 0.5 million barrels.
Crude oil supplies increased in three of the five PAD Districts. PADD 1 (East Coast) crude oil stocks grew 0.2 million barrels, PADD 2 (Midwest) stocks rose 0.4 million barrels, and PADD 5 (West Coast) stocks rose 0.8 million barrels. PADD 3 (Gulf Coast) stocks declined 0.8 million barrels and PADD 4 (Rockies) stocks fell 1.0 million barrels Cushing, Oklahoma inventories increased 1.1 million barrels from the previous report week to 40.5 million barrels.
Domestic crude oil production was unchanged from the previous report week at 11.6 million barrels per day.
Crude oil imports averaged 7.423 million barrels per day, a daily increase of 30,000 barrels per day. Exports rose 51,000 barrels daily to 2.325 million barrels per day.
Refineries used 95.4 per cent of capacity, an increase of 0.4 percentage points from the previous report week.
Crude oil inputs to refineries decreased 28,000 barrels daily; there were 17.408 million barrels per day of crude oil run to facilities. Gross inputs, which include blending stocks, increased 52,000 barrels daily to 17.750 million barrels daily.
Total petroleum product inventories fell 9.4 million barrels from the previous report week.
Gasoline stocks increased 1.8 million barrels from the previous report week; total stocks are 230.1 million barrels.
Demand for gasoline increased 208,000 barrels per day to 9.243 million barrels per day.
Total product demand increased 848,000 barrels daily to 22.329 million barrels per day.
Distillate fuel oil stocks decreased 4.2 million barrels from the previous report week; distillate stocks are 119.9 million barrels. National distillate demand was reported at 4.886 million barrels per day during the report week. This was a weekly increase of 418,000 barrels daily.
Propane stocks decreased 3.3 million barrels from the previous report week; propane stock are 73.2 million barrels. Current demand is estimated at 1.812 million barrels per day, a decrease of 185,000 barrels daily from the previous report week.
Natural Gas
Natural gas prices remained relatively stable through most of 2018. Volatility picked up sharply in recent weeks. The increase reflected, in part, relatively low underground storage. Moreover, consumption of natural gas grew, straining current production. Tight inventories raised prices starting in October, but there has not been much follow through. Nonetheless, low supply continues to inject a measure of uncertainty into the market, reflected in rallies with expectations of colder weather this winter.
According to the EIA,
Net withdrawals from working gas storage were lower than the five-year average for the second week in a row. Net withdrawals from storage totaled 141 Bcf for the week ending December 14, compared with the five-year (2013–17) average net withdrawals of 144 Bcf and last year’s net withdrawals of 166 Bcf during the same week. Working gas stocks totaled 2,773 Bcf, which is 720 Bcf lower than the five-year average and 697 Bcf lower than last year at this time.
Working gas stocks’ deficit to the five-year average decreased, and the deficit to the bottom of the five-year range increased. In the Lower 48 states, total working gas stocks are 450 Bcf lower than the five-year minimum.
Futures trading involves significant risk and is not suitable for everyone. Transactions in securities futures, commodity and index futures and options on future markets carry a high degree of risk. The amount of initial margin is small relative to the value of the futures contract, meaning that transactions are heavily “leveraged”. A relatively small market movement will have a proportionately larger impact on the funds you have deposited or will have to deposit: this may work against you as well as for you. You may sustain a total loss of initial margin funds and any additional funds deposited with the clearing firm to maintain your position. If the market moves against your position or margin levels are increased, you may be called upon to pay substantial additional funds on short notice to maintain your position. If you fail to comply with a request for additional funds within the time prescribed, your position may be liquidated at a loss and you will be liable for any resulting deficit. Past performance may not be indicative of future results. This is not an offer to invest in any investment program.
Powerhouse is a registered affiliate of Coquest, Inc.
Was this memo helpful? We’d like your feedback.
Please respond to [email protected]
Copyright© 2018 Powerhouse, All rights reserved.