- OPEC production cuts should balance market say bank analysts
- Calendar 2019 call strip down $10 since spring
- Support for WTI crude oil found at $50
- Natural gas breaks support on warmer weather

The Matrix
WTI has been flirting with $50 since Thanksgiving. Financial houses are generally bullish and while there are plenty of reasons to be a bear, traders should not ignore the opinions of Goldman Sachs, Morgan Stanley and their like. Here’s Morgan Stanley’s position:
The production cut announced by OPEC+ is likely sufficient to balance the market in 1H19 and prevent inventories from building. Although there are limiting factors too, this should still support a partial recovery in oil prices. We estimate Brent to reach $67.5/bbl by 2Q19, down from $77.5 before.
The calendar 2019 WTI futures strip was worth around $62.50 early in May. It is now trading about ten dollars cheaper. The long period of consolidation now underway could represent overbought relief and establishment of a base for a new attempt on the upside. A collar, buying the 65 call and selling the 45 put is one way to get long.
Major support for WTI crude oil is found at $50. Resistance is at $54.70.
The OPEC+ plan to cut output differs from previous cuts in a few ways. No country-specific limits will be announced. Instead, the group is expected to reduce production by 2.5 per cent. This amounts to 800,000 barrels daily. This is based on the October production level, except that Iran, Venezuela and Libya are not being asked to contribute to the reduction. All three face potential challenges from U.S. sanctions (Iran,) economic instability (Venezuela,) and social unrest (Libya.)
On the other hand, Saudi Arabia reportedly will cut production to 10.2 million barrels per day in January. This is a far greater reduction than the 2.5 per cent stated in the agreement. The purpose of the production declines are likely fulfilled if another half-million barrels daily are lost from other participants,
Oil markets have been here before. Typically, Saudi Arabia carried the bulk of any output reductions. Currently, the Kingdom is facing pressure from the United States where the President is looking for lower oil prices to support a slowing global economy.
Supply/Demand Balances
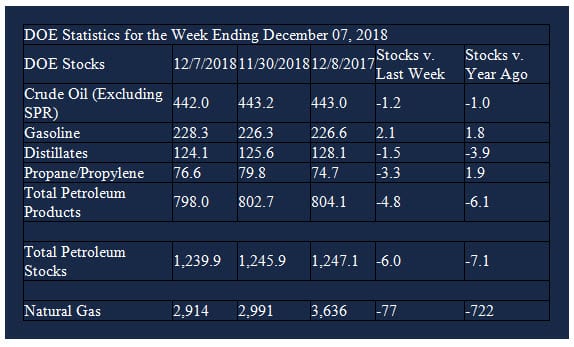
Supply/demand data in the United States for the week ending December 7, 2018 were released by the Energy Information Administration.
Total commercial stocks of petroleum decreased 1.2 million barrels during the week ending December 7, 2018.
There were draws in stocks of fuel ethanol, distillate fuel oil, residual fuel oil, propane, and other oils. Builds were reported in stocks of gasoline and K-jet fuel.
Commercial crude oil supplies in the United States decreased to 442.0 million barrels, a draw of 1.2 million barrels.
Crude oil supplies decreased in four of the five PAD Districts. PADD 1 (East Coast) crude oil stocks declined 2.4 million barrels, PADD 2 (Midwest) stocks retreated 0.2 million barrels, PADD 4 (Rockies) stocks fell 0.6 million barrels, and PAD District 5 (West Coast) stocks were down 1.9 million barrels. There was a build of 3.8 million barrels in PADD 3 (Gulf Coast).
Cushing, Oklahoma inventories increased 1.1 million barrels from the previous report week to 39.4 million barrels.
Domestic crude oil production fell 100,000 barrels daily from the previous report week to 11.6 million barrels per day.
Crude oil imports averaged 7.393 million barrels per day, a daily increase of 174,000 barrels per day. Exports declined 929,000 barrels daily to 2.274 million barrels per day.
Refineries used 95.1 per cent of capacity, a decrease of 0.4 percentage points from the previous report week.
Crude oil inputs to refineries decreased 51,000 barrels daily; there were 17.436 million barrels per day of crude oil run to facilities. Gross inputs, which include blending stocks, decreased 72,000 barrels daily to 17.698 million barrels daily.
Total petroleum product inventories fell 4.8 million barrels from the previous report week.
Gasoline stocks increased 2.1 million barrels from the previous report week; total stocks are 228.3 million barrels.
Demand for gasoline increased 159,000 barrels per day to 9.036 million barrels per day.
Total product demand increased 951,000 barrels daily to 21.481 million barrels per day.
Distillate fuel oil stocks decreased 1.5 million barrels from the previous report week; distillate stocks are 124.1 million barrels. National distillate demand was reported at 4.469 million barrels per day during the report week. This was a weekly increase of 432,000 barrels daily.
Propane stocks decreased 3.2 million barrels from the previous report week; propane stock are 76.6 million barrels. Current demand is estimated at 1.997 million barrels per day, an increase of 676,000 barrels daily from the previous report week.
Natural Gas
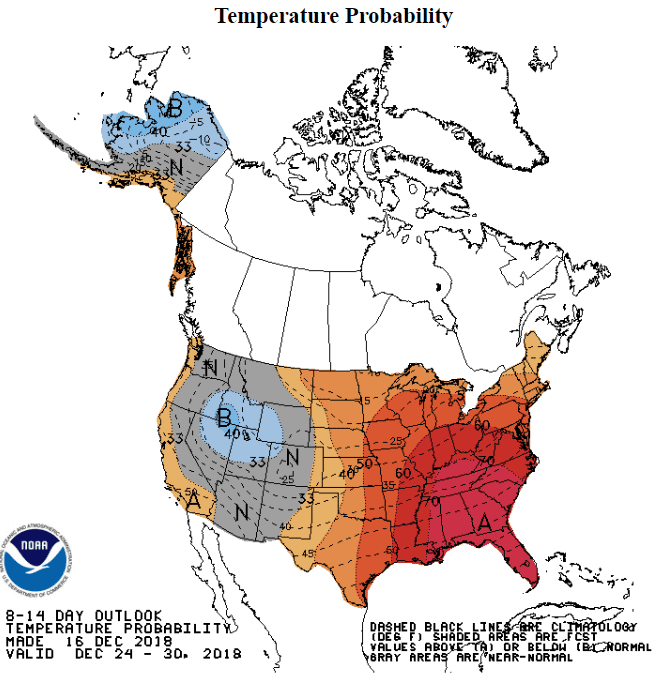
Natural gas prices fell sharply as the week of December 14th ended, notwithstanding storage falling below the five-year average. Daily futures prices fell nearly thirty cents and support at $3.91 was demolished. Unexpectedly high crude oil production is providing associated natural gas to the market, suppressing prices. NOAA 6- to 10- and 8- to 14-day weather maps anticipate warmer than normal temps. Next support is clustered around $3.24.
According to the EIA,
Net withdrawals from working gas storage fell below the five-year average for the first time in five weeks. Net withdrawals from storage totaled 77 Bcf for the week ending December 7, compared with the five-year (2013–17) average net withdrawals of 79 Bcf and last year’s net withdrawals of 59 Bcf during the same week. Working gas stocks totaled 2,914 Bcf, which is 723 Bcf lower than the five-year average and 722 Bcf lower than last year at this time.
Working gas stocks’ deficit to the five-year average decreased, and the deficit to the bottom of the five-year range increased. In the Lower 48 states, total working gas stocks are 427 Bcf lower than the five-year minimum.
Futures trading involves significant risk and is not suitable for everyone. Transactions in securities futures, commodity and index futures and options on future markets carry a high degree of risk. The amount of initial margin is small relative to the value of the futures contract, meaning that transactions are heavily “leveraged”. A relatively small market movement will have a proportionately larger impact on the funds you have deposited or will have to deposit: this may work against you as well as for you. You may sustain a total loss of initial margin funds and any additional funds deposited with the clearing firm to maintain your position. If the market moves against your position or margin levels are increased, you may be called upon to pay substantial additional funds on short notice to maintain your position. If you fail to comply with a request for additional funds within the time prescribed, your position may be liquidated at a loss and you will be liable for any resulting deficit. Past performance may not be indicative of future results. This is not an offer to invest in any investment program.
Powerhouse is a registered affiliate of Coquest, Inc.
Was this helpful? We’d like your feedback.
Please respond to [email protected]
Copyright© 2018 Powerhouse, All rights reserved.