Bullish Price Action Despite Bearish Inventories
- Oil prices end the first half of 2020 on a bullish note
- Oil demand recovering; oil supply overhanging
- OPEC+ group faces resistance to supply cuts
- Natural gas futures remain in a range

The Matrix
The first half of 2020 ended with oil prices moving higher. WTI spot futures prices completed a very wide-ranging year reflecting the economy of the United States’ early high-performing, low unemployment situation, strongly bearish reactions to the Covid-19 pandemic and a significant price recovery despite record-high crude oil inventories closing out the second quarter of 2020.
The year started with WTI spot futures high for the first half of $65.65. This came on January 8. Caution pressed the market lower as talk of a viral epidemic created uncertainty for the market outlook.
On March 7, WTI prices fell sharply. A gap in futures prices appeared that day opening a bearish period lasting until April 20. Negative prices for WTI futures appeared for the first time in history. The May WTI reached a low at negative $40.32 on April 20. WTI could not hold a negative price, and on the next day, crude oil opened at $-14.00, closing May’s expiration day at a positive $10.01.
Several states imposed quarantines on business. Product demand fell and unemployment became a fact of life. Usage has since recovered to a large degree and the number of unemployed workers has diminished. These data encouraged expectations of a stronger economy, supporting the case for higher prices.
Prices of WTI spot futures have moved steadily higher since April 21, reaching $41.63 on June 23. The strength was based on undertakings by OPEC and its producing partners. Substantial losses in U.S. shale oil production have supported prices as well.
The Saudis have managed to keep other OPEC members cooperating in crude oil production constraint but some cracks may be appearing. Iraq, Kazakhstan, Nigeria and Angola have been slow to adopt control measures.
Resistance among overseas producer nations, and some evidence of U.S. shale producers starting now to open production may be an opening wedge in bearish sentiment as the second half of 2020 opens.
The Energy Information Administration is reporting that U.S. commercial crude oil inventories have reached an all-time high. The United States held 541 million barrels of crude oil during the week ending June 19. This was five million barrels more than the previous high level of stocks seen in March, 2017. Moreover, the nation holds 654 million barrels of crude oil in its Strategic Petroleum Reserve.
These volumes of crude oil supply could invite a new bear trend in oil pricing in the second half of 2020.
Supply/Demand Balances
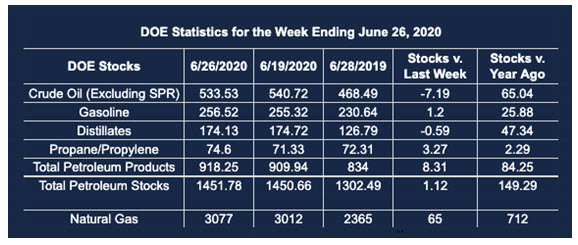
Supply/demand data in the United States for the week ended June 26, 2020, were released by the Energy Information Administration.
Total commercial stocks of petroleum rose by 1.1 million barrels during the week ended June 26, 2020.
Commercial crude oil supplies in the United States decreased by 7.2 million barrels from the previous report week to 533.5 million barrels.
Crude oil inventory changes by PAD District:
PADD 1: UNCH from previous report week at 12.5 million barrels
PADD 2: Down 1.1 million barrels to 136.8 million barrels
PADD 3: Down 4.0 million barrels to 304.0 million barrels
PADD 4: Plus 0.1 from the previous report week to 25.6 million barrels
PADD 5: Down 2.2 million barrels to 54.6 million barrels
Cushing, Okla., inventories were down 0.2 million barrels from the previous report week to 45.6 million barrels.
Domestic crude oil production was unchanged from the previous report week at 11.0 million barrels daily.
Crude oil imports averaged 5.969 million barrels per day, a daily decrease of 571,000 barrels. Exports fell 65,000 barrels daily to 3.092 million barrels per day.
Refineries used 75.5% of capacity, plus 0.9% from the previous report week.
Crude oil inputs to refineries increased 193,000 barrels daily; there were 14.033 million barrels per day of crude oil run to facilities. Gross inputs, which include blending stocks, rose 158,000 barrels daily to reach 14.320 million barrels daily.
Total petroleum product inventories rose 8.3 million barrels from the previous report week.
Gasoline stocks increased 1.2 million barrels daily from the previous report week; total stocks are 256.5 million barrels.
Demand for gasoline fell 47,000 barrels per day to 8.608 million barrels per day.
Total product demand decreased 995,000 barrels daily to 17.353 million barrels per day.
Distillate fuel oil stocks decreased 0.6 million barrels from the previous report week; distillate stocks are at 174.1 million barrels. EIA reported national distillate demand at 3.778 million barrels per day during the report week, an increase of 312,000 barrels daily.
Propane stocks increased 3.3 million barrels from the previous report week; propane stocks are 74.6 million barrels. The report estimated current demand at 695,000 barrels per day, a decrease of 5,000 barrels daily from the previous report week.
Natural Gas
Physical natural gas price at the Henry Hub fell to $1.38 per mmBtu on June 16. This was the lowest daily price reached since December, 1998. An attempt to push futures prices lower reached $1.432 on June 26. Buyers brought the price back into the range that has dominated natural gas futures pricing. The first half of 2020 settled at $1.751.
According to EIA:
The net injections into [natural gas] storage totaled 120 Bcf for the week ending June 19, compared with the five-year (2015–19) average net injections of 73 Bcf and last year’s net injections of 103 Bcf during the same week. Working natural gas stocks totaled 3,012 Bcf, which is 466 Bcf more than the five-year average and 739 Bcf more than last year at this time.
The average rate of injections into storage is 18% higher than the five-year average so far in the refill season (April through October). If the rate of injections into storage matched the five-year average of 8.8 Bcf/d for the remainder of the refill season, the total inventory would be 4,189 Bcf on October 31, which is 466 Bcf higher than the five-year average of 3,723 Bcf for that time of year.
Futures trading involves significant risk and is not suitable for everyone. Transactions in securities futures, commodity and index futures and options on future markets carry a high degree of risk. The amount of initial margin is small relative to the value of the futures contract, meaning that transactions are heavily “leveraged”. A relatively small market movement will have a proportionately larger impact on the funds you have deposited or will have to deposit: this may work against you as well as for you. You may sustain a total loss of initial margin funds and any additional funds deposited with the clearing firm to maintain your position. If the market moves against your position or margin levels are increased, you may be called upon to pay substantial additional funds on short notice to maintain your position. If you fail to comply with a request for additional funds within the time prescribed, your position may be liquidated at a loss and you will be liable for any resulting deficit. Past performance may not be indicative of future results. This is not an offer to invest in any investment program.
Powerhouse is a registered affiliate of Coquest, Inc.
Was this helpful? We’d like your feedback.
Please respond to [email protected]
Copyright© 2020 Powerhouse, All rights reserved.


