Record U.S. LNG Exports
- OPEC+ crude oil supply could decline
- U.S. crude oil supply approaches 13 million b/d
- Chinese refinery demand for crude grows
- Natural gas stocks reach 3.5 Tcf

The Matrix
The talk at meetings of global energy market observers inevitably turns to supply. It is, after all, supply of crude oil that provides the raw material needed to create petroleum products and support global economic activity.
It’s also where easily identified components like OPEC, Saudi Arabia, Russia and OPEC+ can be found. Ironically, it has only been the last couple of years that the United States has become central to discussions of global energy balances. As the U.S. becomes a net exporter of crude oil its significance expands.
Supply has focused on the efforts of Saudi Arabia to limit output from OPEC+ to support prices. OPEC+ has agreed to cut crude oil production by a half million barrels. And Saudi Arabia will reduce its output by an additional 400,000 barrels daily.
Some questions of timing remain unsettled. If fully implemented, OPEC+ crude oil availability should be down by 1.7 million barrels per day. One observer notes this should tighten world markets, but the impact may be simply to raise the floor on world oil prices.
An important challenge facing OPEC+ is continuing expansion of U.S. shale oil production. U.S. output continues to record new highs, despite predictions of domestic production topping out. This result flies in the face of data showing oil rig counts down by a fourth since last year at this time. At the same time, futures markets for WTI crude oil are trading higher. They printed $60 per barrel but are barely sustaining that level.
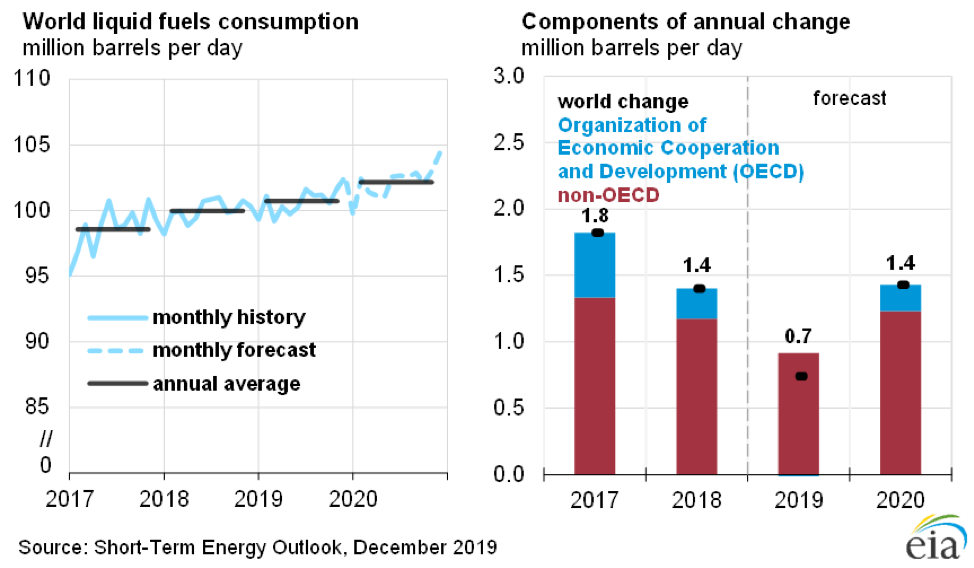
Analysis of World Liquid Fuels Consumption 2017 – 2020 Source: EIA Short Term Energy Outlook
Demand is the other side of the petroleum balance. Consumption has moved slowly ahead, generally advancing at steady annual rates. The United States is the largest consumer by far.
China is becoming part of the demand discussion as its imports of crude oil expand. Growth of Chinese stocks reflects expansion of national storage and added refinery capacity.
Refining in China has shown dramatic growth. The country refined 12.9 million barrels daily in the first 10 months of 2019. This was an increase of 6.4 percent year-on-year.
United States’ refiners input 16.6 million barrels daily in the most recent report (December 6) of the Energy Information Administration.
Supply/Demand Balances
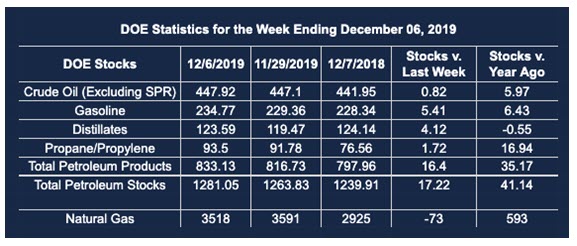
Supply/demand data in the United States for the week ending Dec. 6, 2019, were released by the Energy Information Administration.
Total commercial stocks of petroleum rose by 17.2 million barrels during the week ending Dec. 6, 2019.
Commercial crude oil supplies in the United States increased by 0.8 million barrels from the previous report week to 447.9 million barrels.
Crude oil inventory changes by PAD District:
PADD 1: Down 0.9 million barrels to 10.1 million barrels
PADD 2: Down 4.7 million barrels to 126.5 million barrels
PADD 3: Plus 5.5 million barrels to 235.3 million barrels
PADD 4: Plus 0.2 million barrels to 24.0 million barrels
PADD 5: Plus 0.8 million barrels to 52.0 million barrels
Cushing, Oklahoma inventories fell 3.4 million barrels from the previous report week to 40.4 million barrels.
Domestic crude oil production fell 100,000 barrels per day from the previous report week to 12.8 million barrels daily.
Crude oil imports averaged 6.887 million barrels per day, a daily increase of 899,000 barrels. Exports rose 265,000 barrels daily to 3.400 million barrels per day.
Refineries used 90.6 percent of capacity, down 1.3% from the previous report week.
Crude oil inputs to refineries decreased 201,000 barrels daily; there were 16.597 million barrels per day of crude oil run to facilities. Gross inputs, which include blending stocks, fell 244,000 barrels daily to reach 17.040 million barrels daily.
Total petroleum product inventories rose 16.4 million barrels from the previous report week.
Gasoline stocks increased 5.4 million barrels daily from the previous report week; total stocks are 234.8 million barrels.
Demand for gasoline fell 149,000 barrels per day to 8.882 million barrels per day.
Total product demand decreased 2.730 million barrels daily to 18.359 million barrels per day.
Distillate fuel oil stocks increased 4.1 million barrels from the previous report week; distillate stocks are at 123.6 million barrels. EIA reported national distillate demand at 3.731 million barrels per day during the report week, an increase of 175,000 barrels daily.
Propane stocks increased 1.7 million barrels from the previous report week; propane stocks are 93.5 million barrels. The report estimated current demand at 756,000 barrels per day, a decrease of 1.016 million barrels daily from the previous report week.
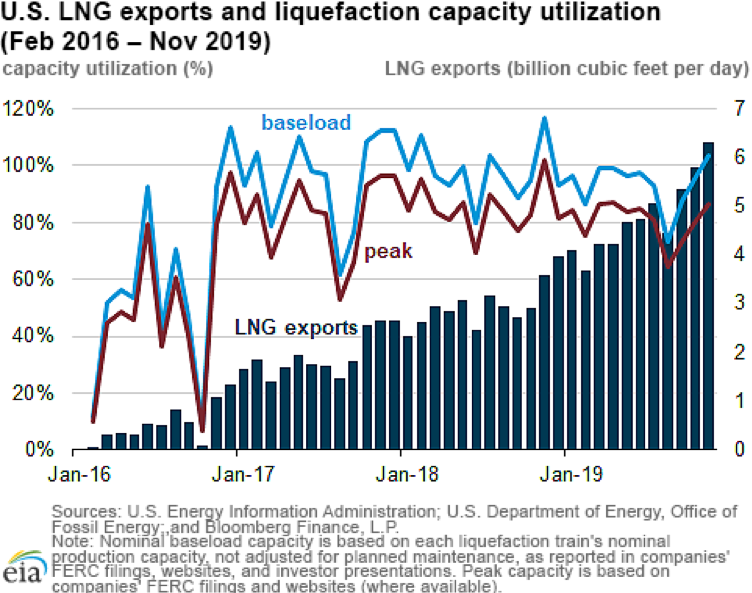
Exports of liquefied natural gas (LNG) are expanding at record rates. EIA noted that records were set in both October and November. The Administration said, “From January through November 2019, U.S. LNG exports averaged 4.8 Bcf/d, 61% higher than in 2018 (3.0 Bcf/d annual average), as the United States became the third-largest LNG exporter in the world.”
According to the Energy Information Administration:
The net [natural gas] withdrawal from storage totaled 73 Bcf for the week ending December 6, compared with the five-year (2014–18) average net withdrawal of 68 Bcf and last year’s net withdrawal of 75 Bcf during the same week. Working natural gas stocks totaled 3,518 Bcf, which is 14 Bcf lower than the five-year average and 593 Bcf more than last year at this time.
Futures trading involves significant risk and is not suitable for everyone. Transactions in securities futures, commodity and index futures and options on future markets carry a high degree of risk. The amount of initial margin is small relative to the value of the futures contract, meaning that transactions are heavily “leveraged”. A relatively small market movement will have a proportionately larger impact on the funds you have deposited or will have to deposit: this may work against you as well as for you. You may sustain a total loss of initial margin funds and any additional funds deposited with the clearing firm to maintain your position. If the market moves against your position or margin levels are increased, you may be called upon to pay substantial additional funds on short notice to maintain your position. If you fail to comply with a request for additional funds within the time prescribed, your position may be liquidated at a loss and you will be liable for any resulting deficit. Past performance may not be indicative of future results. This is not an offer to invest in any investment program.
Powerhouse is a registered affiliate of Coquest, Inc.
Was this helpful? We’d like your feedback.
Please respond to [email protected]
Copyright© 2019 Powerhouse, All rights reserved.