Short Supply Heralds Price Volatility
- Crude inventory levels falling rapidly
- Days’ supply in the lower third of its range
- Price volatility likely to follow
- Dry natural gas production rising

Alan Levine—Chairman, Powerhouse
(202) 333-5380
The Matrix
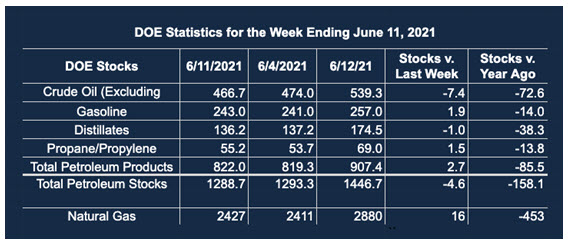
Stocks of commercial crude oil fell to 466.7 million barrels during the week ended June 11. This came when crude oil supplies recorded their fifth consecutive weekly decline. (Stocks stood at 486.0 million barrels on May 14.)
The loss of supply would ordinarily be seen as bullish, but after several weeks of unremitting rally crude oil futures have eased off their highs, trading in a range. Bullish expectations for demand remain a principal market moving factor.
Lower inventories become even more problematic when seen through the lens of days’ supply. (Total inventories divided by demand.) Crude oil supply is now enough to handle 29.6 days of supply. In March, the United States had 41.8 days’ supply.
Distillate fuel oil stocks are enough for 34.0 days’ supply. One year ago, the lockdowns implemented to fight COVID-19 backed up enough distillate fuel oil for 53 days of supply.
The 34 days’ supply of distillate is in the lower third of historical supply. This is partially why oil markets are resisting a deeper sell-off. Powerhouse puts support for crude oil futures at $66. Distillate fuel oil support is around $1.99.
Tight availability of petroleum supply raises concerns for volatility, with its heightened risk profile. The ongoing shift from traditional supply sources to renewables will impact the source of financing exploration and production budgets.
Crude oil price objectives have recently been set at $80 by one of the large investment banks. Control over output by OPEC+ and investment trending away from traditional drilling has caused some analysts to suggest even higher price potentials like $100 or more. Sell-offs could test $35, according to the same logic.
Other uncertainties should be evaluated as well. One is the impact of COVID-19 variants and progress toward universal vaccination.
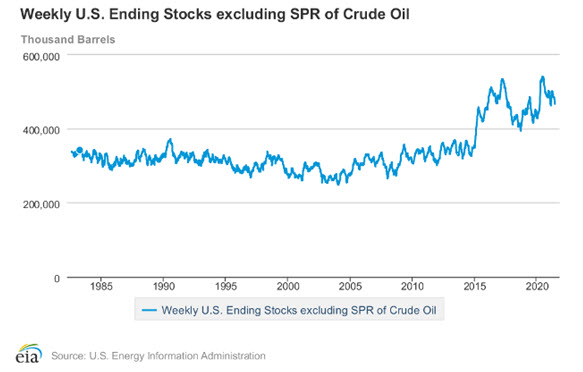
U.S. Crude Stocks, 1980 – 2021 Source: EIA
Supply/Demand Balances
Supply/demand data in the United States for the week ended June 11, 2021, were released by the Energy Information Administration.
Total commercial stocks of petroleum fell 4.6 million barrels during the week ended June 11, 2021.
Commercial crude oil supplies in the United States decreased by 7.4 million barrels from the previous report week to 466.7 million barrels.
Crude oil inventory changes by PAD District:
PADD 1: Down 1.0 to 8.0 million barrels
PADD 2: Down 3.7 million barrels to 129.6 million barrels
PADD 3: Down 1.7 million barrels to 256.3 million barrels
PADD 4: Plus 0.1 million barrels to 25.0 million barrels
PADD 5: Down 1.2 million barrels to 47.7 million barrels
Cushing, Oklahoma inventories were down 2.1 million barrels from the previous report week to 43.6 million barrels.
Domestic crude oil production was up 0.2 million barrels per day from the previous report to 11.2 million barrels daily.
Crude oil imports averaged 6.746 million barrels per day, a daily increase of 108,000 barrels. Exports increased 953,000 barrels daily to 3.884 million barrels per day.
Refineries used 92.6% of capacity, 1.3 percentage points higher from the previous report week.
Crude oil inputs to refineries increased 412,000 barrels daily; there were 16.337 million barrels per day of crude oil run to facilities. Gross inputs, which include blending stocks, rose 225,000 barrels daily to 16.742 million barrels daily.
Total petroleum product inventories rose 2.8 million barrels from the previous report week.
Gasoline stocks increased 2.0 million barrels from the previous report week; total stocks are 243.0 million barrels.
Demand for gasoline rose 880,000 barrels per day to 9.360 million barrels per day.
Total product demand increased 2.858 million barrels daily to 20.571 million barrels per day.
Distillate fuel oil stocks fell 1.0 million barrels from the previous report week; distillate stocks are at 136.2 million barrels. EIA reported national distillate demand at 4.336 million barrels per day during the report week, an increase of 4.336 million barrels daily.
Propane stocks rose 1.5 million barrels from the previous report week; propane stocks stood at 55.2 million barrels. The report estimated current demand at 703,000 barrels per day, a decrease of 47,000 barrels daily from the previous report week.
Natural Gas
The price spike that brought spot natural gas futures to $3.33 garnered very little additional support. The week ended June 18, 2021, moved futures down to $3.166 before settling at $3.215.
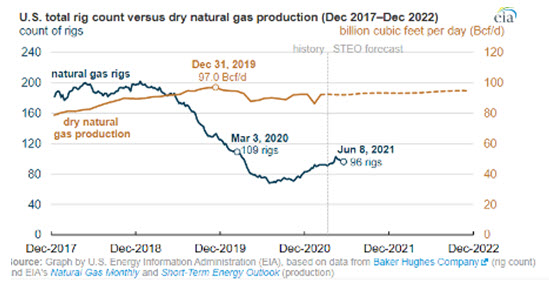
The failure to reach higher may reflect an increase in natural gas production. Output clocked in at 92.2 billion daily cubic feet for May 2021. Production in May 2020 was 87.8 billion cubic feet per day. DOE expects dry production to average 94.8 Bcf/d in the last months of 2022, slightly short of output in December 2019 when maximum production of 97.0 Bcf/d was recorded.
DOE’s expectations of growing natural gas production have not been universally embraced. Some producers have reduced their drilling plans to support payouts to investors.
Demand growth may overcome efforts to reduce output being utilized by these U.S. drillers. Temperatures ran into three digits in the Southwest recently, another unusual call on inventory. Global demand has also supported higher prices. Gains in the industrial sector could support higher prices as well.
Demand growth in natural gas has bloomed before, but production gains have tempered price increases. This year, production slowdowns could support growth in prices.
According to the EIA:
The net [natural gas] injections into storage totaled 16 Bcf for the week ended June 11, compared with the five-year (2016–2020) average net injections of 87 Bcf and last year’s net injections of 86 Bcf during the same week. Working natural gas stocks totaled 2,427 Bcf, which is 126 Bcf lower than the five-year average and 453 Bcf lower than last year at this time. This week’s working gas total reflects reclassifications from working to base gas that reduced working gas inventories by 51 Bcf in the Pacific region, for the week ended June 11.
The average rate of injections into storage is 13% lower than the five-year average so far in the refill season (April through October). If the rate of injections into storage matched the five-year average of 8.2 Bcf/d for the remainder of the refill season, the total inventory would be 3,593 Bcf on October 31, which is 126 Bcf lower than the five-year average of 3,719 Bcf for that time of year.
Was this helpful? We’d like your feedback.
Please respond to [email protected]
Powerhouse Futures & Trading Disclaimer
Copyright 2021 Powerhouse Brokerage, LLC, All rights reserved