Distillate Futures Price Trendless
- COVID-19 variants revive pandemic
- ULSD demand lagging
- COVID infections surge again
- Natural gas injections to storage lag five-year average

Alan Levine—Chairman, Powerhouse
(202) 333-5380

The Matrix
Distillate fuel oil futures prices have yet to establish a trend heading into autumn. ULSD rallied through the spring. Spot futures gained $0.48 from March through early July. Prices reached $2.21; they have since backed off, rangebound between the $2.21 and $1.96.
ULSD’s springtime rally reflected the idea that COVID-19 had largely run its course. Masks came off, how distant was social distancing became chatter at well-attended social events, and vaccination rates fell off the charts.
Variants of COVID-19 now made their appearances and slowed the pace of improved demand. Delta variant was the focus of the renewed impact of COVID-19. The expectations for demand growth in the second half of this year now should be reviewed considering the latest spike in COVID-19 cases.
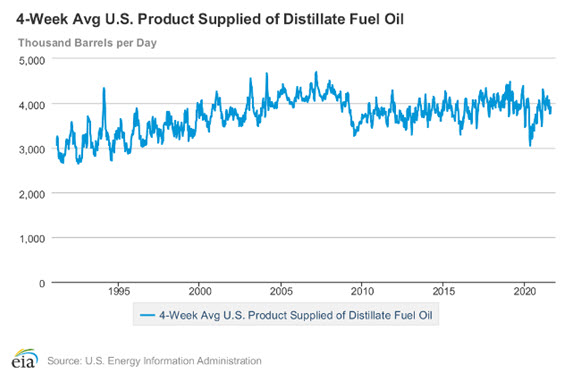
Distillate Fuel Supplied – 4-Week Average 1990 – 2021 Source: EIA
Demand for distillate fuels fell sharply in 2020 as the economy went into lockdown. Consumption fell to 3 million barrels daily in in the four-weeks ended May 1, 2020. This level had not been seen since the mid-1990s. As the economy reacted to an improving COVID-19 situation, demand reached 4.3 million barrels in February 2021, (assisted by winter heat requirements). Demand has since fallen back reaching 3.9 million daily barrels in the four weeks ended Aug. 6, 2021.
The conflict between a growing economy and a growing epidemic remains the main uncertainty for those charged with analyzing market activity. The state of COVID-19 medical treatment is running into limits of beds, staff and equipment. Mandates for masking are reappearing and orders to return to work are being deferred. An anti-vaccination sentiment has slowed the impact of vaccines and cut into demand.
ULSD demand is a measure of commercial economic health. The inability of price to push to new highs in the past few weeks indicates a slowdown in the robust economic growth so recently experiences.
Supply/Demand Balances
Supply/demand data in the United States for the week ended Aug. 06, 2021, were released by the Energy Information Administration.
Total commercial stocks of petroleum fell 0.1 million barrels during the week ended Aug. 06, 2021.
Commercial crude oil supplies in the United States decreased by 0.4 million barrels from the previous report week to 438.8 million barrels.
Crude oil inventory changes by PAD District:
PADD 1: Down 0.9 million barrels to 7.9 million barrels
PADD 2: Down 1.2 million barrels to 117.1 million barrels
PADD 3: Plus 1.2 million barrels to 242.9 million barrels
PADD 4: Down 0.5 million barrels to 24.2 million barrels
PADD 5: Plus 0.2 million barrels to 46.8 million barrels
Cushing, Oklahoma, inventories were down 0.3 million barrels from the previous report week to 34.6 million barrels.
Domestic crude oil production was up 100,000 million barrels per day from the previous report week to 11.2 million barrels daily.
Crude oil imports averaged 6.396 million barrels per day, a daily decrease of 36,000 barrels. Exports increased 759,000 barrels daily to 2.663 million barrels per day.
Refineries used 91.8% of capacity; 0.5 percentage points higher from the previous report week.
Crude oil inputs to refineries increased 277,000 barrels daily; there were 16.197 million barrels per day of crude oil run to facilities. Gross inputs, which include blending stocks, rose 103,000 barrels daily to 16.569 million barrels daily.
Total petroleum product inventories rose 0.3 million barrels from the previous report week.
Gasoline stocks decreased 1.4 million barrels from the previous report week; total stocks are 227.5 million barrels.
Demand for gasoline fell 345,000 barrels per day to 9.430 million barrels per day.
Total product demand decreased 1.654 million barrels daily to 19.514 million barrels per day.
Distillate fuel oil stocks rose 1.8 million barrels from the previous report week; distillate stocks are at 140.5 million barrels. EIA reported national distillate demand at 3.734 million barrels per day during the report week, an increase of 116,000 barrels daily.
Propane stocks fell 0.6 million barrels from the previous report week; propane stocks are at 65.3 million barrels. The report estimated current demand at 1.114 million barrels per day, an increase of 158,000 barrels daily from the previous report week.
Natural Gas
Halfway through the season, natural gas storage injections continue to lag the 5-year average. European gas is well short of the five-year average as well. And there are questions about the availability of supply from Russia via the Nord Stream 2 pipeline.
Data provider Refinitiv said the amount of gas flowing to U.S. LNG export plants is expected to jump to a four-week high of 10.9 bcfd in the next two weeks as several Gulf Coast plants, including Cameron and Sabine in Louisiana and Freeport in Texas, have returned nearly to full service.
With European and Asian gas both trading over $16 per mmBtu, compared with around $4 for the U.S. fuel, analysts said buyers around the world would keep purchasing all the LNG the United States can produce. Prices at the Title Transfer Facility (TTF) in the Netherlands, the European benchmark, were at a record high.
Some relief might come as U.S. producers are slowly resuming oil production with its attendant associated natural gas.
According to the EIA:
[Natural gas] net injections into storage totaled 49 Bcf for the week ended August 6, compared with the five-year (2016–2020) average net injections of 42 Bcf and last year’s net injections of 55 Bcf during the same week. Working natural gas stocks totaled 2,776 Bcf, which is 178 Bcf lower than the five-year average and 548 Bcf lower than last year at this time.
The average rate of injections into storage is 13% lower than the five-year average so far in the refill season (April through October). If the rate of injections into storage matched the five-year average of 8.9 Bcf/d for the remainder of the refill season, the total inventory would be 3,541 Bcf on October 31, which is 178 Bcf lower than the five-year average of 3,719 Bcf for that time of year.
Was this helpful? We’d like your feedback.
Please respond to [email protected]
Powerhouse Futures & Trading Disclaimer
Copyright 2021 Powerhouse Brokerage, LLC, All rights reserved