Oil Fundamentals Look Weak
1. Refining output lags
2. Overall oil demand is soft
3. Propane demand gains year-on-year
4. Weather outlook calls for more storms

The Matrix
The onset of the COVID-19 pandemic and its impact on economic activity in the United States can be seen in this chart showing the use of domestic refining capacity.
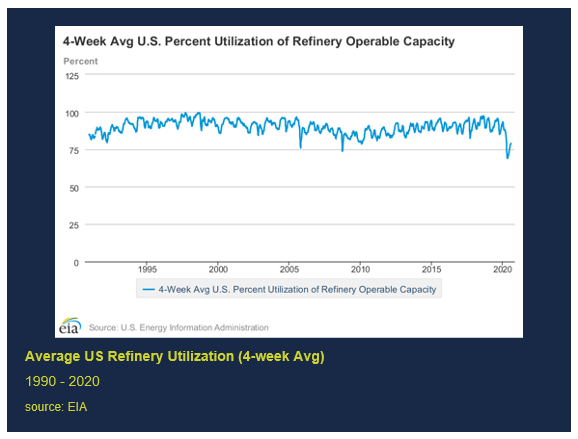
Refineries in the United States have run between the upper 70% level and full out capacity since 1990.
Two notable dips in usage occurred in 2008 and, more recently, this past May. The four-week average use of refineries fell to 73.7% in September 2008, responding to the economic meltdown associated with global financial failures. (One week’s activity registered 66.7% at that time.)
The May, 2020 loss of refining fell to 68.9%. Only now has domestic refining recovered. The four weeks ending July 31 recorded refinery throughput of 78.7% of capacity.
The recovery in refining activity comes at a time when petroleum demand is under pressure. Losses in transportation demand have been especially notable among airlines. Moreover, several refiners have announced reductions in capacity. Facilities in the San Fransisco Bay Area, and Gallup, New Mexico are being idled “indefinitely.” A long-standing refinery in Philadelphia will be dismantled by its new owner, a property developer. These facilities will result in the loss of more than 500,000 barrels per day of domestic refining.
The U.S. Petroleum Balance Sheet for the week ended July 31, shows total product demand for 2020 year-to-date at 18.1 million barrels daily. Last year at this time, demand was 20.6 million barrels per day. Total demand is down 12.3%.
K-jet fuel has suffered a particularly large decline in demand. Usage was put at 1.1 million barrels daily, a drop of 38.1% year-to-date. Gasoline demand lags last year by 14.7%, at 8.0 million barrels per day.
Soft demand has characterized much of 2020 for dealers. The situation has been improving for gasoline. In mid-April, gasoline demand fell to 5.3 million barrels per day as the enormity of sheltering-in-place took its toll. Gasoline demand fell more than 40% when considering the four-week average in the prior year, 2019. At the end of July, four-week demand lagged the prior year by less than 10%.
Distillate fuel oil demand has had a more varied response during this time. Four-week demand lagged the comparable previous year by more than 20% as recently as mid-June. July ended with distillate usage less than nine percent below last year.
The recovery in product demand while refining capacity is being lost could lead to higher prices. It could also encourage product Imports. Product imports are now 2.2 million barrels daily.
Propane is the only petroleum product to record a gain in demand. EIA reports propane use of 1.1 million barrels daily year-to-date, a gain of 4% over last year.
Weak demand, increasing utilization of refining facilities and a dramatic fall in domestic GDP are a recipe for lower product prices. Globally, Libyan production has added over 500,000 barrels of crude to supply daily. Declines in U.S. production appear to have stabilized at eleven million barrels daily.
Supply/Demand Balances
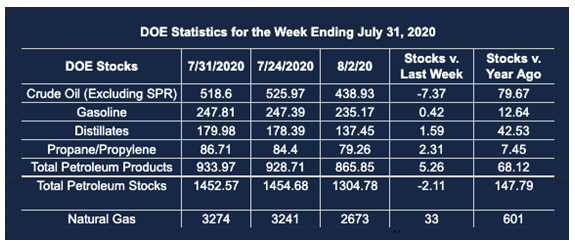
Supply/demand data in the United States for the week ended July 31, 2020, were released by the Energy Information Administration.
Total commercial stocks of petroleum fell by 2.1 million barrels during the week ended July 31, 2020.
Commercial crude oil supplies in the United States decreased by 7.4 million barrels from the previous report week to 518.6 million barrels.
Crude oil inventory changes by PAD District:
PADD 1: Down 0.7 million barrels to 12.0 million barrels
PADD 2: Plus 0.5 million barrels to 140.2 million barrels
PADD 3: Down 7.4 million barrels to 295.5 million barrels
PADD 4: Down 0.3 million barrels to 25.0 million barrels
PADD 5: Plus 0.5 million barrels to 53.3 million barrels
Cushing, Oklahoma inventories were up 0.6 million barrels from the previous report week to 50.1 million barrels.
Domestic crude oil production was fell 100,000 barrels per day from the previous report week to 11.0 million barrels daily.
Crude oil imports averaged 6.010 million barrels per day, a daily increase of 864,000 barrels. Exports declined 392,000 barrels daily to 2.819 million barrels per day.
Refineries used 79.6% of capacity, up 0.1% from the previous report week.
Crude oil inputs to refineries increased 42,000 barrels daily; there were 14.637 million barrels per day of crude oil run to facilities. Gross inputs, which include blending stocks, rose 14,000 barrels daily to reach 15.104 million barrels daily.
Total petroleum product inventories fell 5.3 million barrels from the previous report week.
Gasoline stocks increased 0.4 million barrels daily from the previous report week; total stocks are 247.8 million barrels.
Demand for gasoline fell 193,000 barrels per day to 8.617 million barrels per day.
Total product demand decreased 1.182 million barrels daily to 17.912 million barrels per day.
Distillate fuel oil stocks increased 1.6 million barrels from the previous report week; distillate stocks are at 180.0 million barrels. EIA reported national distillate demand at 3.700 million barrels per day during the report week, an increase of 65,000 barrels daily.
Propane stocks increased 2.3 million barrels from the previous report week; propane stocks are 86.7 million barrels. The report estimated current demand at 786,000 barrels per day, a decrease of 643,000 barrels daily from the previous report week.
Natural Gas
Weather remains an important unknown as the 2020 hurricane season advances. NOAA has released a new estimate of storm activity. The agency now expects between 19 and 25 named storms. Seven to 11 could become hurricanes. Nine named storms have already occurred this season. These numbers are substantially higher than those released in May which called for “a 60% likelihood of an above-average season, with a 70% chance of 13 to 19 named storms, six to ten of which would become hurricanes.”
According to the EIA:
The net injections [of natural gas] into storage totaled 33 Bcf for the week ending July 31, compared with the five-year (2015–19) average net injections of 33 Bcf and last year’s net injections of 58 Bcf during the same week. Working natural gas stocks totaled 3,274 Bcf, which is 429 Bcf more than the five-year average and 601 Bcf more than last year at this time.
The average rate of injections into storage is 10% higher than the five-year average so far in the refill season (April through October). If the rate of injections into storage matched the five-year average of 9.5 Bcf/d for the remainder of the refill season, the total inventory would be 4,152 Bcf on October 31, which is 429 Bcf higher than the five-year average of 3,723 Bcf for that time of year.
Futures trading involves significant risk and is not suitable for everyone. Transactions in securities futures, commodity and index futures and options on future markets carry a high degree of risk. The amount of initial margin is small relative to the value of the futures contract, meaning that transactions are heavily “leveraged”. A relatively small market movement will have a proportionately larger impact on the funds you have deposited or will have to deposit: this may work against you as well as for you. You may sustain a total loss of initial margin funds and any additional funds deposited with the clearing firm to maintain your position. If the market moves against your position or margin levels are increased, you may be called upon to pay substantial additional funds on short notice to maintain your position. If you fail to comply with a request for additional funds within the time prescribed, your position may be liquidated at a loss and you will be liable for any resulting deficit. Past performance may not be indicative of future results. This is not an offer to invest in any investment program.
Powerhouse is a registered affiliate of Coquest, Inc.
Was this helpful? We’d like your feedback.
Please respond to [email protected]
Copyright© 2020 Powerhouse, All rights reserved.