Oil Supply/Demand Data Delayed; What’s the Outlook?
- EIA data delayed
- Looking at other fundamentals
- Spot ULSD futures trading mid $4.20’s
- Natural gas storage expands
Sincerely,
Alan Levine, Chairman
Powerhouse
(202) 333-5380
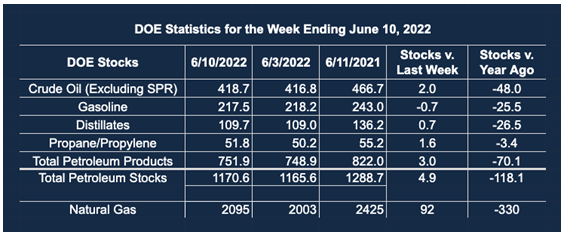
Please Note: The EIA experienced systems issues last week, and the energy supply and demand data for the week ended June 17th has been delayed. Therefore, the table above reflects the week ended June 10th.
The Matrix
The US Petroleum Balance Sheet for the week ended June 17 has been delayed as a result of “system issues.” EIA notes it remains, “committed to our mission of collecting, analyzing, and disseminating independent and impartial energy information.” The importance of EIA’s independent and impartial data distribution has become central to decision-making in the energy sector.
Before EIA’s work was available, analysts relied on combing through many separate sources of information of varying degrees of reliability. Decisions were only as good as their sources. The weekly release of the US Petroleum Balance Sheet has provided a solid base for management choices.
What’s the state of the petroleum markets without EIA data? A sampling of recent information from the press might give us some idea.
- Without data from the EIA, we rely on press-reported stories, non-governmental information, and trade talk. Anecdotal material, often useful and usually (but not always) accurate, does not replace the gold standard the EIA’s reports have become.
- The rocky road is leaving analysts scrambling for answers. The S&P may drop a further 24% by year-end, if the past 150 years are any guide, SocGen quants said. Their calculations show it may need to tumble 40% from its January peak to hit bottom. (The Bloomberg Open, June 24)
- An oil industry meeting with Energy Secretary Jennifer Granholm to lower gas prices and boost domestic oil supplies was constructive, but did not produce a major breakthrough, administration and industry officials said Thursday.
The closed-door meeting came as President Joe Biden called on Congress to suspend federal taxes on gasoline and diesel fuel as a way to relieve high gas prices that have frustrated drivers and spurred inflation. The Democratic president also called on states to suspend their own gas taxes or provide similar relief, and he delivered a public critique of the energy industry for prioritizing profits over production. (The Associated Press, June 23, 2022)
Chicago gasoline prices falling, a negative view of the stock markets and jawboning to lower retail gasoline prices paint a bearish picture for oils going forward. (Statistics for oil and natural gas were produced well after the actual events before the EIA.)
Futures prices, themselves, are another source of market information. The chart of spot ULSD futures is shown below:
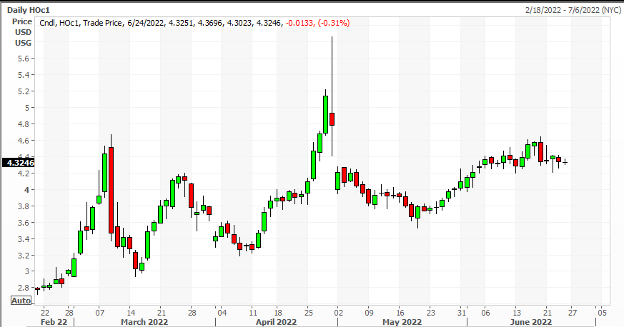
ULSD Front Month Feb – June 2022 Source: CME, Futuresource
Powerhouse has discussed the spring rally and subsequent loss of value of ULSD at length. Price action since the end of April has been restrained. “Where next?” is an open question.
The specter of further conflict in Europe and implications for recession on the other hand heighten the imperative to use options on futures in developing winter cap over the next few years.
Supply/Demand Balances
Please Note: The EIA experienced systems issues last week, and the energy supply and demand data for the week ended June 17th has been delayed.
Natural Gas
Natural gas injected into underground storage reached 74 Bcf last week. The higher-than-expected increase reflected natural gas stranded with the accident at Freeport’s LNG export facility.
Spot futures natural gas prices fell. Support at $6.345 broke, opening the path to major support at $5.26. The decline in prices came despite warmer temperatures. Cooling degree days ran 21 degrees above normal for the nation as a whole, and 27 degrees in the East North Central states. New England and Middle Atlantic states, by contrast, hardly moved from normal.
The underlying fundamental situation has not turned bearish, however. Challenges to the European Union have not abated. Russian supply has been squeezed and further cuts could add 5.5% LNG trade growth in 2022, according to some analysts. Global demand for LNG could reach 444 million tons by 2026. It stood at 375 million tons last year, one analytic group said.
New LNG projects along the Gulf Coast are now in train to supplement US LNG export capabilities. Expansions in Louisiana and Texas have been greenlighted.
According to the EIA:
Net injections [of natural gas] into storage totaled 74 Bcf for the week ended June 17, compared with the five-year (2017–2021) average net injections of 82 Bcf and last year’s net injections of 49 Bcf during the same week. Working natural gas stocks totaled 2,169 Bcf, which is 331 Bcf lower than the five-year average and 305 Bcf lower than last year at this time.
The average rate of injections into storage is 6% lower than the five-year average so far in the refill season (April through October). If the rate of injections into storage matched the five-year average of 8.4 Bcf/d for the remainder of the refill season, the total inventory would be 3,314 Bcf on October 31, which is 331 Bcf lower than the five-year average of 3,645 Bcf for that time of year.
Was this helpful? We’d like your feedback.
Please respond to [email protected]
Powerhouse Futures & Trading Disclaimer
Copyright 2022 Powerhouse Brokerage, LLC, All rights reserved