Oil Market Extends Bearish Track
- OECD oil supplies exceeding the 5-year average level
- Inventory build more-than-offsets OPEC production cuts
- Iran blamed for tanker attacks in the Gulf of Oman
- U.S. natural gas production keeps prices under pressure
The Matrix
Bearish market expectations are becoming more common. Both demand and supply are showing softness. Inventories are growing. According to OPEC, oil stocks in developed economies increased in April, exceeding the five-year average by 7.6 million barrels.
The build occurred despite OPEC’s apparently successful agreement to cut production. OPEC reported a decline in May of 236,000 barrels daily. All 14 OPEC nations produced 29.88 million barrels per day in May. The group is set to meet later in June to determine whether to extend the agreement.
The situation in U.S. inventories parallels foreign experience. DOE notes that “U.S. crude oil inventories increased recently, during a time of year when they typically decrease (Figure 2). Total U.S. crude oil inventories increased by 15.7 million barrels in May, compared with a five-year average decrease of 2.1 million barrels for the month. If confirmed in monthly data, the May 2019 stock build would be the largest for any May since 1991.”
Consumption growth is flagging too. The U.S. EIA has revised downward its estimate of 2019 growth in global oil demand. The agency now expects global demand growth to be 1.22 million barrels per day, a slowdown of 160,000 barrels daily. Projected global demand growth in 2020 has been reduced by 110,000 barrels daily to 1.42 million barrels per day.
OPEC’s ability to sustain its reduced output level could be explained in part by the group’s expectations of lower global demand too.
Geopolitical reality remains a critical factor when thinking about prices notwithstanding the generally bearish turn taken by oil markets. During the night of June 13, 2019, mine explosions damaged oil tankers in the Gulf of Oman. The price of crude oil surged on the news, moving more than a dollar before falling back. And later in the day, the U.S. named Iran as the attacker. Again, prices surged and fell back.
No degree of petroleum oversupply or reduced demand can eliminate concerns for volatility’s effect on pricing. Market participants would do well to consider protective strategies like stops or options when determining when or whether to buy or sell.
Supply/Demand Balances
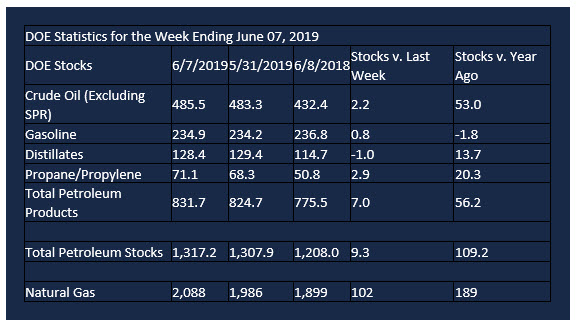
Supply/demand data in the United States for the week ending June 7, 2019, were released by the Energy Information Administration.
Total commercial stocks of petroleum rose 9.3 million barrels during the week ending June 7, 2019.
There were builds in stocks of gasoline, K-jet fuel, residual fuel, propane, and other oils. There were draws in stocks of fuel ethanol and distillates.
Commercial crude oil supplies in the United States rose 2.2 million barrels from the previous report week to 485.5 million barrels.
Crude oil supplies increased in three of the five PAD Districts. PADD 1 (East Coast) crude oil stocks rose 0.2 million barrels, PADD 2 (Midwest) stocks advanced 1.9 million barrels, and PADD 5 (West Coast) stocks rose 1.4 million barrels.
Cushing, Oklahoma inventories were up 2.1 million barrels from the previous report week to 52.9 million barrels.
Domestic crude oil production fell 100,000 barrels per day from the previous report week to 12.3 million barrels daily.
Crude oil imports averaged 7.611 million barrels per day, a daily decrease of 316,000 barrels. Exports decreased 176,000 barrels daily to 3.122 million barrels per day.
Refineries used 93.2 percent of capacity, an increase of 1.4 percentage points from the previous report week.
Crude oil inputs to refineries increased 126,000 barrels daily; there were 17.064 million barrels per day of crude oil run to facilities. Gross inputs, which include blending stocks, rose 308,000 barrels daily to 17.535 million barrels daily.
Total petroleum product inventories rose 7.1 million barrels from the previous report week.
Gasoline stocks increased 0.8 million barrels daily from the previous report week; total stocks are 234.9 million barrels.
Demand for gasoline rose 436,000 barrels per day to 9.877 million barrels per day.
Total product demand increased 1.674 million barrels daily to 21.123 million barrels per day.
Distillate fuel oil stocks decreased 1.0 million barrels from the previous report week; distillate stocks are at 128.4 million barrels. EIA reported national distillate demand at 4.368 million barrels per day during the report week, a weekly increase of 981,000 barrels daily.
Propane stocks increased 2.9 million barrels from the previous report week; propane stocks are 71.1 million barrels. The Report estimated current demand at 906,000 barrels per day, an increase of 88,000 barrels daily from the previous report week.
Natural Gas
According to the Energy Information Administration:
Net injections into storage totaled 102 Bcf for the week ending June 7, compared with the five-year (2014–18) average net injections of 92 Bcf and last year’s net injections of 95 Bcf during the same week. Working gas stocks totaled 2,088 Bcf, which is 230 Bcf lower than the five-year average and 189 Bcf more than last year at this time.
If the rate of injections into storage matched the five-year average of 9.4 Bcf/d for the remainder of the refill season, total inventories would be 3,462 Bcf on October 31, which is 230 Bcf lower than the five-year average of 3,692 Bcf for that time of year.
Natural gas prices (NG futures priced at Henry Hub) approached $5 late in 2018 before starting a decline that is still in play. Falling prices reflected expanding global supplies of LNG while winter weather was turning mild. As U.S. production further expands the LNG supply, prices remain under pressure.
Futures trading involves significant risk and is not suitable for everyone. Transactions in securities futures, commodity and index futures and options on future markets carry a high degree of risk. The amount of initial margin is small relative to the value of the futures contract, meaning that transactions are heavily “leveraged”. A relatively small market movement will have a proportionately larger impact on the funds you have deposited or will have to deposit: this may work against you as well as for you. You may sustain a total loss of initial margin funds and any additional funds deposited with the clearing firm to maintain your position. If the market moves against your position or margin levels are increased, you may be called upon to pay substantial additional funds on short notice to maintain your position. If you fail to comply with a request for additional funds within the time prescribed, your position may be liquidated at a loss and you will be liable for any resulting deficit. Past performance may not be indicative of future results. This is not an offer to invest in any investment program.
Powerhouse is a registered affiliate of Coquest, Inc.
Was this helpful? We’d like your feedback.
Please respond to [email protected]
Copyright© 2019 Powerhouse, All rights reserved.


