Oil Prices Rangebound; Stocks Rise, Demand Slows, Regional Unrest Unresolved
- Oil trading ranges are limited by contradiction and uncertainty
- Current supply/demand balances are not bullish
- Iranian retaliation on Israel for Israeli attack in Syria could open a new war front
- Above-average natural gas inventories could drag on prices through 2025
Sincerely,
Alan Levine, Chair
Powerhouse
(202) 333-5380
The Matrix
Spot futures prices for petroleum products traded in narrow ranges last week, with ULSD highs lower and lows higher than the week before. As noted in Powerhouse’s Weekly Energy Market Situation last week, ULSD needs to trade above $2.80 to sustain its rally. Prices wound up at $2.6846, closer to support than resistance.
Gasoline eked out a new high, ended the week $0.0125 below the prior week. Crude oil posted a new weekly high by pennies but closed the week ended April 11 $1.25 lower than the week before.
It was a lackluster performance for the liquids complex.
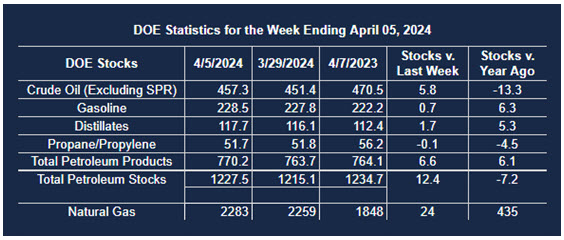
The U.S. Petroleum Balance Sheet for the week ended April 5, 2024, was released by the Energy Information Administration. The data did not support the bullish price case.
Inventory gains were reported in every petroleum category. Total stocks (excluding the SPR) increased by 12.4 million barrels during the reporting week.
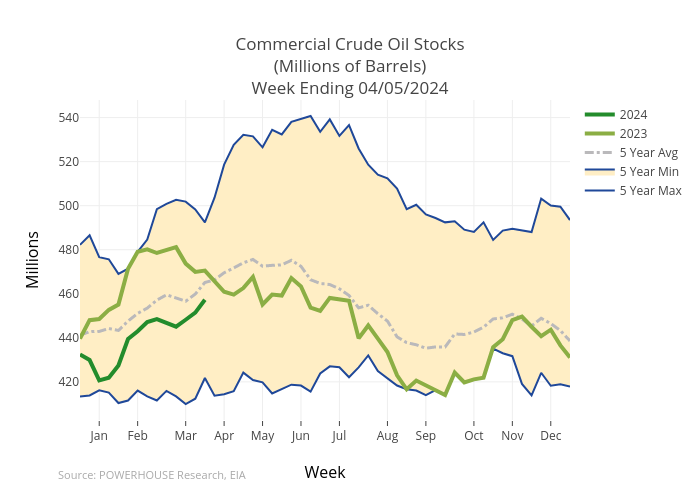
Commercial crude oil added 5.8 million barrels to inventory – 46.8% of the total increase. Facilities on the Gulf Coast accounted for 7.1 million barrels of the gain, despite a small increase in crude oil run to refineries.
West Coast storage fell by two million barrels during the week. Refining saw a resurgence as refinery use reached 86.4%, a gain of 3.6 percentage points. The transition to summer RVP values is nearly complete, accounting for much of the recovery in refining operations.
Inventories of Other Oils increased by 4.6 million barrels during the report week, second to crude oil. This is a large number, but not very useful for an understanding of the supply situation because “Other Oils” is a balancing item. It includes NGPLS, LRGs (except propane/propylene), and kerosene along with several other minor petroleum products).
The report was bearish for price because of inventory gains. A decline in demand of 2.1 million barrels daily for all petroleum products was weak too. But prices, as noted, did not respond bearishly.
The incongruency reflects the difference between a currently bearish reality and unusually uncertain geopolitical expectations. Further escalation of Middle East tension could yet occur.
A new front in the regional war could come from Iran. Massive response by Iran to Israel’s strike on the Iranian consulate in Syria — about 360 drones and missiles aimed at Israeli targets — was an embarrassing failure for the Iranian regime. Israel has yet to respond.
This brings us to uncharted territory: a violent response not yet initiated by Israel and sentiments widely voiced by other governments, both pro- and anti-Israeli, urging restraint. Iran gave advance warning of its intention and did not escalate by using its regional proxies. “Israel is looking at options that would “send a message” but not cause casualties. Those options include a potential strike on a facility in Tehran or a cyberattack. The Jewish State must balance short-term responses and longer-term objectives, including rehabilitation in the international community.
Supply/Demand Balances
Supply/demand data in the United States for the week ended April 5, 2024, were released by the Energy Information Administration.
Total commercial stocks of petroleum increased (⬆) 12.4 million barrels to 1.2275 billion barrels during the week ended April 5, 2024.
Commercial crude oil supplies in the United States were higher (⬆) by 5.9 million barrels from the previous report week to 457.3 million barrels.
Crude oil inventory changes by PAD District:
PADD 1: Up (⬆) 0.5 million barrels at 7.9 million barrels
PADD 2: Up (⬆) 0.4 million barrels to 119.9 million barrels
PADD 3: Up (⬆) 7.1 million barrels to 257.5 million barrels
PADD 4: Down (⬇) 0.2 million barrels at 25.8 million barrels
PADD 5: Down (⬇) 2 million barrels to 46.2 million barrels
Cushing, Oklahoma, inventories were down (⬇) 0.2 million barrels from the previous report week to 33 million barrels.
Domestic crude oil production was unchanged (=) at 13.1 million barrels daily.
Crude oil imports averaged 6.434 million barrels per day, a daily decrease (⬇) of 183,000 barrels. Exports decreased (⬇) 1.314 million barrels daily to 2.708 million barrels per day.
Refineries used 88.3% of capacity; 0.3 percentage points lower (⬇) than the previous report week.
Crude oil inputs to refineries decreased (⬇) 115,000 barrels daily; there were 15.782 million barrels per day of crude oil run to facilities. Gross inputs, which include blending stocks, decreased (⬇) 56,000 barrels daily to 16.193 million barrels daily.
Total petroleum product inventories increased (⬆) by 6.5 million barrels from the previous report week, up to 770.2 million barrels.
Total product demand decreased (⬇) 2,056,000 barrels daily to 19.236 million barrels per day.
Gasoline stocks increased (⬆) 0.7 million barrels from the previous report week; total stocks are 228.5 million barrels.
Demand for gasoline decreased (⬇) 624,000 barrels per day to 8.612 million barrels per day.
Distillate fuel oil stocks increased (⬆) 1.7 million barrels from the previous report week; distillate stocks are at 117.7 million barrels. EIA reported national distillate demand at 2.985 million barrels per day during the report week, a decrease (⬇) of 509,000 barrels daily.
Propane stocks fell 100,000 barrels (⬇) from the previous report to 51.7 million barrels. The report estimated current demand at 1,305,000 barrels per day, a decrease (⬇) of 124,000 barrels daily from the previous report week.
Natural Gas
Spot natural gas futures ended the week of April 11 virtually unchanged from the week before, and in the same general range as they have held for the past five weeks. Settling at $1.77, prices were only seven cents above $1.70, a level we have identified as a significant low previously.
Historically, natural gas prices would be bottoming in mid-April, attendant on the summer and developing Cooling Degree Days (CDDs) that should push storage lower and pull prices higher. To date, however, Degree Days have done little to add to demand.
The United States has developed 2,654 Heating Degree Days (HDDs) from last July through April 6. This is 106 HDDs fewer than normal, and 502 HDDs fewer than last fiscal year. CDDs have barely registered on the temperature scale this year.
NOAA has reported that the country recorded its warmest winter and the warmest December in many places. This was especially important in the northern and central U.S., where most households use natural gas for space heating.
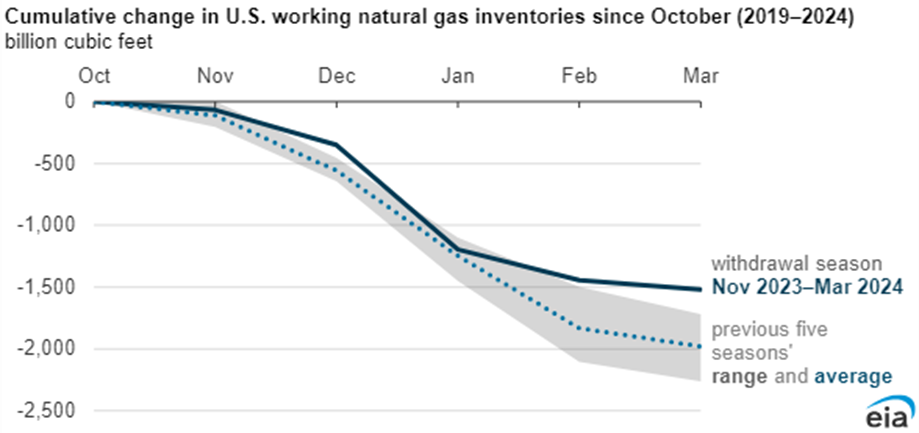
The Energy Information Administration now posits that mild weather may lead to high inventories through 2025, challenging natural gas buyers.
EIA data for the week ended April 5 showed injections into underground storage of 24 Bcf. Stocks are now 38% greater than the average of the past five years.
Data source: U.S. Energy Information Administration, Natural Gas Monthly and Weekly Natural Gas Storage Report
Data values: Underground Natural Gas Storage by All Operators and Working Gas in Underground Storage
Note: February and March 2024 values are interpolated from weekly data.
The buildup of natural gas inventories was supercharged by the performance of domestic production. Powerhouse has reported record production in November and December 2023, averaging about 106.5 Bcf. The overhang has also caused several producers to announce curtailment of production or planned capital investments in natural gas this year.
The United States experienced 5% warmer weather this winter than last, 6% less consumption, and 3% more production, producing 24% more natural gas in storage.
According to the EIA:
- Net injections into storage totaled 24 Bcf for the week ended April 5, on par with the five-year (2019–2023) average net injections of 24 Bcf and higher than last year’s net injections of 11 Bcf during the same week. Working natural gas stocks totaled 2,283 Bcf, which is 633 Bcf (38%) more than the five-year average and 435 Bcf (24%) more than last year at this time.
- According to The Desk survey of natural gas analysts, estimates of the weekly net change to working natural gas stocks ranged from no net change to net injections of 18 Bcf, with a median estimate of net injections of 13 Bcf.
Was this helpful? We’d like your feedback.
Please respond to [email protected]
This material has been prepared by a sales or trading employee or agent of Powerhouse Brokers, LLC and is, or is in the nature of, a solicitation. This material is not a research report prepared by Powerhouse Brokers, LLC. By accepting this communication, you agree that you are an experienced user of the futures markets, capable of making independent trading decisions, and agree that you are not, and will not, rely solely on this communication in making trading decisions.
DISTRIBUTION IN SOME JURISDICTIONS MAY BE PROHIBITED OR RESTRICTED BY LAW. PERSONS IN POSSESSION OF THIS COMMUNICATION INDIRECTLY SHOULD INFORM THEMSELVES ABOUT AND OBSERVE ANY SUCH PROHIBITION OR RESTRICTIONS. TO THE EXTENT THAT YOU HAVE RECEIVED THIS COMMUNICATION INDIRECTLY AND SOLICITATIONS ARE PROHIBITED IN YOUR JURISDICTION WITHOUT REGISTRATION, THE MARKET COMMENTARY IN THIS COMMUNICATION SHOULD NOT BE CONSIDERED A SOLICITATION.
The risk of loss in trading futures and/or options is substantial and each investor and/or trader must consider whether this is a suitable investment. Past performance, whether actual or indicated by simulated historical tests of strategies, is not indicative of future results. Trading advice is based on information taken from trades and statistical services and other sources that Powerhouse Brokers, LLC believes are reliable. We do not guarantee that such information is accurate or complete and it should not be relied upon as such. Trading advice reflects our good faith judgment at a specific time and is subject to change without notice. There is no guarantee that the advice we give will result in profitable trades.
Copyright 2024 Powerhouse Brokers, LLC, All rights reserved