‘Tis the Season for Lower Prices: Opportunities for 2026
- Seasonal sell-off pushing ULSD and RBOB prices to multi-month lows
- Risk/reward balance shifting in favor of a scale-in strategy
- Natural gas correcting, but upside potential remains
Sincerely,
Elaine Levin
President
Powerhouse
(202) 333-5380

The Matrix
The petroleum markets have handed buyers a significant gift. Prices have fallen to levels not seen in many months. It is not uncommon to see a sell-off in petroleum prices as the year comes to a close. Falling prices create distinct advantages for many market participants. Gasoline retailers are experiencing expanding margins. Heating oil distributors have the best of both worlds – cold weather and falling prices. The sell-off is attracting fuel consumers’ attention. In a recent conversation, a client asked the question that is on everyone’s mind: “Prices are better than last year—should I step in?”
Consider the magnitude of the recent price move: ULSD futures have retreated from November highs of $2.72 to under $2.15. During that same period, RBOB dropped from over $2.02 to under $1.70. As reported in last week’s Energy Market Situation, multiple bearish factors have contributed to the sell-off. Refiners are running at a high rate. Floating crude oil inventory at sea is significant. Peace talks are ongoing to end the war in Ukraine.
Consider the magnitude of the recent price move: ULSD futures have retreated from November highs of $2.72 to under $2.15. During that same period, RBOB dropped from over $2.02 to under $1.70. As reported in last week’s Energy Market Situation, multiple bearish factors have contributed to the sell-off. Refiners are running at a high rate. Floating crude oil inventory at sea is significant. Peace talks are ongoing to end the war in Ukraine.
While momentum remains bearish, current price levels warrant a re-evaluation of hedging coverage, particularly given emerging supply-side risks. The U.S. administration’s approach to Venezuela is shifting to active enforcement. As noted by Bloomberg, the U.S. has intensified naval interdiction efforts, including the recent seizure of the Centuries supertanker. The seizure signals a willingness to disrupt the “dark fleet” logistics network that ferries sanctioned crude to China.
Given the combination of favorable pricing and looming uncertainty, a scale-in strategy is prudent, whether using futures or options.
This approach offers distinct advantages:
- The Gasoline Marketer: Lower wholesale prices are currently supporting healthier margins. Marketers should consider hedging spring gallons, especially with summer-grade futures trading below $2.00 per gallon.
- The Heating Oil Distributor: Prices for winter 2026-2027 have been approaching $2.00 per gallon. This is an opportunity.
- The End User of Fuel: Current prices provide budget certainty at values not seen for some time. Scaling coverage now secures lower operating costs in 2026.
We are not suggesting the market has hit an absolute bottom. However, we are saying that the risk/reward balance has shifted. With prices historically attractive and geopolitical risks still very much in the headlines, the cost of doing nothing is starting to outweigh the potential savings of a further drop.
Supply/Demand Balances
Supply/demand data in the United States for the week ending December 12, 2025, were released by the Energy Information Administration.
Total commercial stocks of petroleum increased (⬆) 2.1 million barrels to 1.2750 billion barrels during the week ending December 12th, 2025.
Commercial crude oil supplies in the United States were lower (⬇) by 1.3 million barrels from the previous report week to 424.4 million barrels.
Crude oil inventory changes by PAD District:
PADD 1: Down (⬇) 0.1 million barrels to 7.8 million barrels
PADD 2: Up (⬆) 0.1 million barrels to 102.1 million barrels
PADD 3: Down (⬇) 1.1 million barrels to 241.7 million barrels
PADD 4: Up (⬆) 0.1 million barrels to 25.2 million barrels
PADD 5: Down (⬇) 0.2 million barrels to 47.6 million barrels
Cushing, Oklahoma, inventories inventories were down (⬇) 0.7 million barrels to 20.9 million barrels.
Domestic crude oil production decreased (⬇) 10,000 barrels per day from the previous report to 13.843 million barrels per day.
Crude oil imports averaged 6.525 million barrels per day, a daily decrease (⬇) of 64,000 barrels. Exports increased (⬆) 655,000 barrels daily to 4.664 million barrels per day.
Refineries used 94.8 percent of capacity; an increase (⬆) of 0.3 percent from the previous report week.
Crude oil inputs to refineries increased (⬆) 128,000 barrels daily; there were 16.988 million barrels per day of crude oil run to facilities. Gross inputs, which include blending stocks, increased (⬆) 57,000 barrels daily to 17.209 million barrels daily.
Total petroleum product inventories increased (⬆) by 3.5 million barrels from the previous report week, down to 850.6 million barrels.
Total product demand decreased (⬇) 509,000 barrels daily to 20.573 million barrels per day.
Gasoline stocks increased (⬆) 4.8 million barrels from the previous report week; total stocks are 225.6 million barrels.
Demand for gasoline increased (⬆) 622,000 barrels per day to 9.078 million barrels per day.
Distillate fuel oil stocks increased (⬆) 1.7 million barrels from the previous report week; distillate stocks are at 118.5 million barrels. EIA reported national distillate demand at 3.786 million barrels per day during the report week, a decrease (⬇) of 372,000 barrels daily.
Propane stocks fell (⬇) by 1.8 million barrels to 100.0 million barrels. The report estimated current demand at 1,181,000 barrels per day, an decrease (⬇) of 5,000 barrels daily from the previous report week.
Natural Gas
Natural gas prices retreated from recent highs above $5.00, driven by forecasts of a year-end warming trend. The sell-off found support near $3.80, a technically significant level that marks the top of the gap created when the November contract expired, and December became the spot month. A move below $3.80 would open the door for prices to test the $3.572 support level, which would also fill the gap on the chart. Elliott wave analysis suggests that the latest move down is a 4th-wave correction. As long as prices hold at $3.572 (the bottom of the gap), a 5th and final wave up remains a possibility.
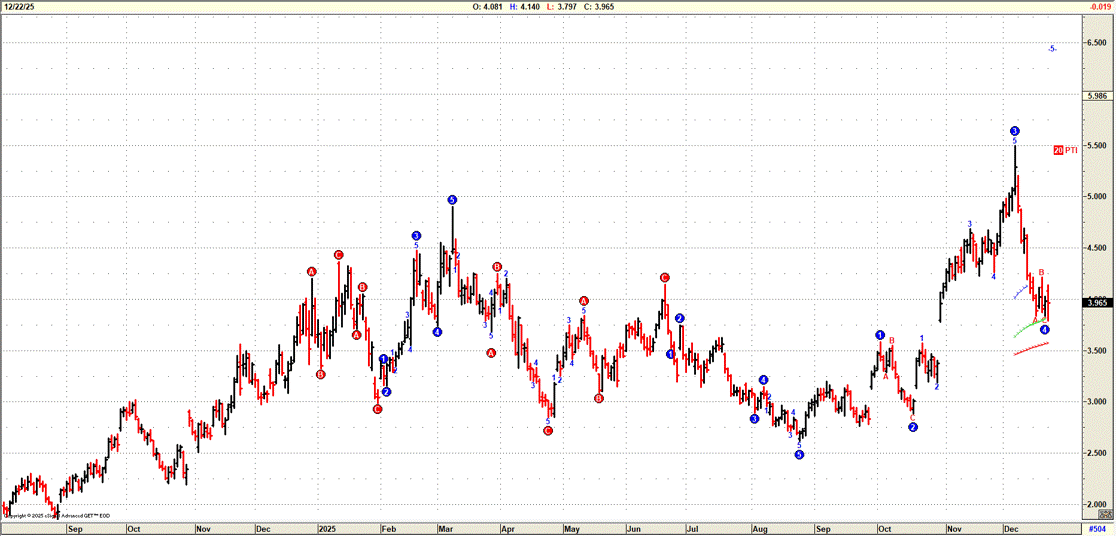
Chart title: Daily Continuation Natural Gas Chart, NYMEX Source: GET, eSignal
According to the EIA:
- Net withdrawals from storage totaled 167 Bcf for the week ending December 12, compared with the five-year (2020–24) average net withdrawals of 96 Bcf and last year’s net withdrawals of 134 Bcf during the same week. Working natural gas stocks totaled 3,579 Bcf, which is 32 Bcf (1%) more than the five-year average and 61 Bcf (2%) lower than last year at this time. Current inventories in the East and Midwest natural gas storage regions are about 5% under the five-year average.
Was this helpful? We’d like your feedback.
Please respond to [email protected]
This material has been prepared by a sales or trading employee or agent of Powerhouse Brokers, LLC and is, or is in the nature of, a solicitation. This material is not a research report prepared by Powerhouse Brokers, LLC. By accepting this communication, you agree that you are an experienced user of the futures markets, capable of making independent trading decisions, and agree that you are not, and will not, rely solely on this communication in making trading decisions.
DISTRIBUTION IN SOME JURISDICTIONS MAY BE PROHIBITED OR RESTRICTED BY LAW. PERSONS IN POSSESSION OF THIS COMMUNICATION INDIRECTLY SHOULD INFORM THEMSELVES ABOUT AND OBSERVE ANY SUCH PROHIBITION OR RESTRICTIONS. TO THE EXTENT THAT YOU HAVE RECEIVED THIS COMMUNICATION INDIRECTLY AND SOLICITATIONS ARE PROHIBITED IN YOUR JURISDICTION WITHOUT REGISTRATION, THE MARKET COMMENTARY IN THIS COMMUNICATION SHOULD NOT BE CONSIDERED A SOLICITATION.
The risk of loss in trading futures and/or options is substantial and each investor and/or trader must consider whether this is a suitable investment. Past performance, whether actual or indicated by simulated historical tests of strategies, is not indicative of future results. Trading advice is based on information taken from trades and statistical services and other sources that Powerhouse Brokers, LLC believes are reliable. We do not guarantee that such information is accurate or complete and it should not be relied upon as such. Trading advice reflects our good faith judgment at a specific time and is subject to change without notice. There is no guarantee that the advice we give will result in profitable trades.
Copyright 2025 Powerhouse Brokers, LLC, All rights reserved