Excerpted from This Week in Petroleum, June 23, 2021
A combination of increasing travel and economic activity in the United States has contributed to greater demand for gasoline, distillate, and jet fuel as identified in the product supplied data in our Weekly Petroleum Status Report (WPSR). Although demand has increased for all three of these products from their 2020 lows, the rate and extent of the growth has differed by product. According to the June 23 WPSR that includes data through June 18, the recent four-week average demand (measured as product supplied) for gasoline was 94% of its 2019 level for the same time of year, while distillate and jet fuel demand were 98% and 74% of their 2019 levels, respectively (Figure 1). In comparison, at their lowest points in 2020, gasoline product supplied fell to 56% of its corresponding 2019 level, while distillate and jet fuel demand fell to 80% and 31%, respectively, of their corresponding 2019 levels.
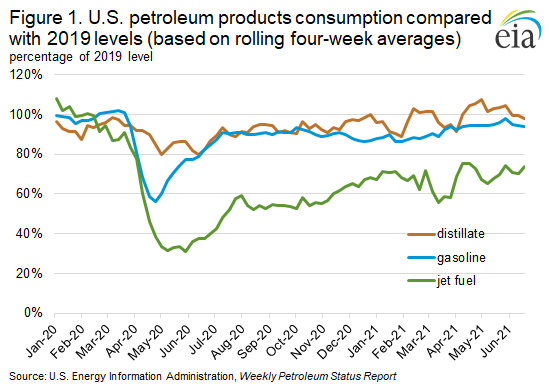
We estimate product supplied by the volume of petroleum products delivered out of the primary supply chain. Although these petroleum products are ultimately consumed, product supplied is a measure of the volumes further up the supply chain than at the point of consumption. Even though product supplied is a reasonable proxy for consumption, weekly data may reflect temporary demand, trade, or inventory fluctuations, so four-week rolling averages often provide a better indication of longer-term consumption trends.
Based on rolling four-week averages, U.S. gasoline demand fell from 9.3 million barrels per day (b/d) during the week of March 13, 2020 (when President Trump declared a national emergency), to a low of 5.3 million b/d on April 24, 2020. Demand for U.S. gasoline then increased, surpassing 8.2 million b/d during the week of June 26, 2020. Demand growth then slowed and declined at the end of 2020, primarily as a result of a significant increase in COVID-19 cases and reinstated travel restrictions. Beginning in March 2021, however, demand resumed growing, and consumption rose above 9.0 million b/d during the week of May 21 for the first time since March 20, 2020 (Figure 2).

Increasing U.S. gasoline consumption is consistent with trends seen in Google Mobility data (presented by Our World in Data), which show how visits (number of trips) and length of stay at home changed from a baseline that is based on the five-week period of January 3 through February 6, 2020. Google mobility data indicate that travel to most places (except to places of work, which has remained nearly flat) has increased steadily since the beginning of the year. At the same time, the residential category has decreased, reflecting a decrease in time spent at home. Economic recovery, easing concerns about COVID-19, and seasonal effects are likely driving the mobility growth.
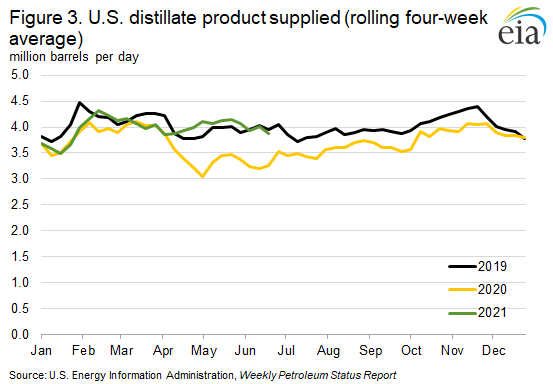
COVID-19 did not affect distillate consumption as much as gasoline or jet fuel consumption. Distillate consumption in the United States is driven by economic activity and is more directly affected by changes in freight transport than by travel restrictions or work-from-home trends. Distillate fuel is also used in activities that are less related to mobility restrictions, such as construction, space heating in buildings, and commercial/industrial burners. In addition, demand for distribution of necessities, such as food and medical supplies, and increased home deliveries for goods likely contributed to relatively stable demand for distillate fuel. From the end of 2020 to the start of April 2021, distillate product supplied had generally been near 2019 levels, and it has exceeded 2019 levels most weeks beginning in April 2021 (Figure 3). Distillate consumption is supported by trucking and rail demand. According to the American Trucking Association, the truck tonnage index is well above the low levels seen last year. In addition to high trucking demand, weekly data from the American Association of Railroads indicate rail traffic in 2021 is generally trending near 2019 levels with the exception of a sharp decrease in February due to extreme winter weather that led railroads to curtail operations. The generally high level of rail demand is contributing to overall distillate demand.
Demand for U.S. jet fuel has also increased from its 2020 lows as personal travel has increased, but it has not approached its 2019 levels as closely as gasoline and distillate have. International travel restrictions, concerns about rising COVID-19 case counts in other countries, and reduced business travel have probably contributed to the relatively slower return in jet fuel demand. Although international flights are usually fewer in number than domestic flights, the size of the planes and distance traveled on international flights contribute to a larger share of jet fuel consumption than flight capacity or passenger numbers alone would indicate. Although demand for jet fuel has been increasing, as of June 18, it has remained low, and product supplied data indicate it is more than 25% below 2019 levels for the same time of year (Figure 4).
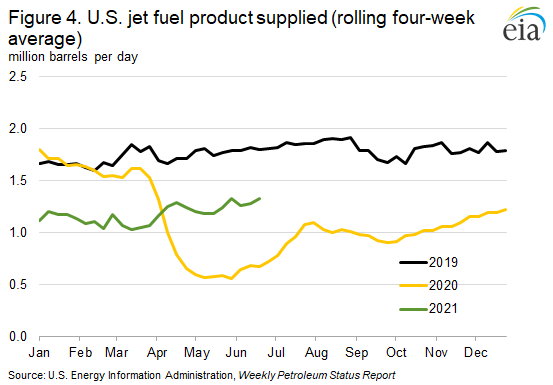
Data from the Transportation Security Administration (TSA) indicate that passenger throughput (based on the seven-day moving average) has increased significantly beginning in February of this year, rising from approximately 660,000 passengers per day on February 1 to 2.0 million passengers per day on June 22. Although this change reflects a significant increase, it is still more than 25% below 2019 levels. TSA passenger throughput does not distinguish between passengers for international and domestic destinations; however, more U.S. passengers have historically traveled to domestic destinations. The growth in jet fuel demand may be slower than gasoline and distillate fuel if travelers maintain some aversion to flying. In addition, business travel and conferences remain largely virtual, a trend that may affect jet fuel consumption permanently.