
MARKET SNAPSHOT
By Dr. Nancy Yamaguchi
September 13, 2019: An eventful week drove oil prices up and down. The week began with a new Saudi Arabian Energy Minister. WTI crude prices briefly passed the $58/b mark on reports of a large draw from crude inventors. However, concerns of oversupply rose when President Trump fired National Security Advisor John Bolton, presaging a possible thawing of U.S.-Iran relations. Markets in general rose upon apparent goodwill moves between the U.S. and China in advance of next month’s trade talks. Today, prices are gradually rising. Our weekly price review covers hourly forward prices from 9AM EST Friday September 6th through Friday September 13th. Three summary charts are followed by the Price Movers This Week briefing for a more thorough review.
GASOLINE PRICES
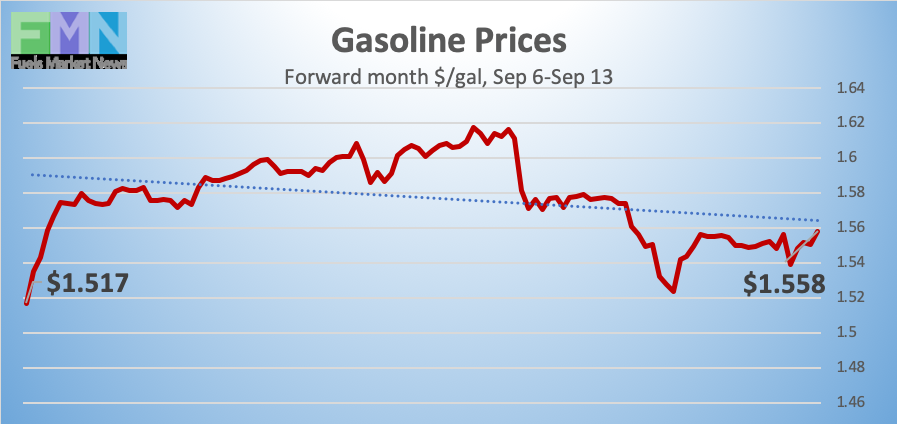
Gasoline opened on the NYMEX at $1.5461/gallon on Friday September 6th, and prices opened at $1.5555/gallon on Friday September 13th. This was an increase of 0.94 cents (0.6%.) U.S. average retail prices fell during the week ended September 9th. This week brought an inventory drawdown, which supported prices midweek. Subsequently, the drop in crude prices drove product prices down. Gasoline prices are recovering this morning, and the week appears to be heading for an end in the black. Trades are occurring mainly in the range of $1.53-$1.56/gallon. The latest price is $1.5547/gallon.
DIESEL PRICES

Diesel opened on the NYMEX at $1.8868/gallon on Friday September 6th and opened on Friday September 13th at $1.8881/gallon, up slightly by 0.13 cents (0.1%.) This week brought a small drawdown in diesel inventories, which supported prices midweek. Diesel forward prices have opened higher for five consecutive weeks, though this week’s prices rose and then subsided nearly to Monday’s starting point when crude prices fell. Prices this morning have flattened. Contracts currently are trading in the $1.86-$1.89/gallon range. The latest price is $1.878/gallon.
WEST TEXAS INTERMEDIATE PRICES

PRICE MOVERS THIS WEEK : BRIEFING
An eventful week drove prices up then down. Saudi Arabia’s King Salman dismissed Energy Minister Khalid Al-Falih over the weekend, appointing instead his son Prince Abdulaziz bin Salman. Prices rose briefly. No changes in policy were announced, and the current production cut agreement is expected to remain in place. Inventory drawdowns supported prices on Tuesday and Wednesday. But prices dropped when President Donald Trump fired National Security Advisor John Bolton. The move is expected to presage a softening of the U.S. stance toward Iran. Bolton had advocated as complete a shut-in of Iranian exports as possible. While viewed as positive for regional and global markets in general, relaxing sanctions on Iran would allow Iranian crude exports to re-enter the market, potentially adding to oversupply. OPEC reported that Iranian crude production fell to 2194 kbpd in August. In contrast, Iranian crude production in 2017 had averaged 3813 kbpd—over 1600 kbpd more than current levels.
The American Petroleum Institute (API) reported a major drawdown of 7.2 million barrels (mmbbls) from crude inventories. This was well above market expectations of a 2.5-mmbbl stock draw. The API reported a large stock draw of 4.5 mmbbls from gasoline inventories and an addition of 0.618 mmbbls to diesel inventories. Market experts had predicted a smaller draw from gasoline stockpiles, and a very small drawdown from diesel inventories. The API’s net inventory drawdown was 11.082 mmbbls.
Official statistics from the Energy Information Administration (EIA) largely corroborated the API data on the drawdown from crude stockpiles, coming in at 6.912 mmbbls. The gasoline drawdown, however, was much smaller at 0.682 mmbbls, and the addition to diesel inventories was more significant at 2.704 mmbbls. The net stock draw was a 4.89 mmbbls, less than half of what the API had reported.
The EIA also reported that during the week ended August 30th, U.S. crude oil production remained flat at 12.4 million barrels per day (mmbpd.) The EIA still foresees growth in output in the coming year. However, Baker Hughes reported that the U.S. active oil and gas rig count fell by 6 during the week ended September 6th. The rig count has fallen by 185 so far this year, dropping from 1083 at the end of December to 898 during the week ended September 6th. A resumption of Iranian crude exports could drive oil prices down, potentially cutting further into the U.S. active rig count.
Markets reacted positively to progress in the U.S.-China trade war. China may exempt soybeans and pork from the tariff list, in advance of next month’s meetings.