Excerpted from This Week in Petroleum
Release Date: October 4, 2023
Publicly-trade U.S. oil companies increased spending on capital expenditures and mergers and acquisitions in the second quarter of 2023 (2Q23), according to financial results from 40 publicly traded exploration and production (E&P) companies, at a time when cash from operations fell. Because cash from operations declined, the E&P companies supported investing activities in 2Q23 by reducing shareholder returns by 39% compared with the 2022 quarterly average and increasing net debt by $5.6 billion. Crude oil and natural gas liquids (NGL) production by these E&P companies increased to an average of 6.3 million barrels per day (b/d), nearly equal to the pre-pandemic high in 1Q20.
We base our analysis on the published financial reports of 40 publicly traded oil companies that produce most of their crude oil in the United States. As a result, our observations do not represent the entire sector because we exclude private companies, which do not publish financial reports. These 40 publicly traded companies collectively accounted for 33% of all crude oil and NGL produced in the United States in 2Q23.
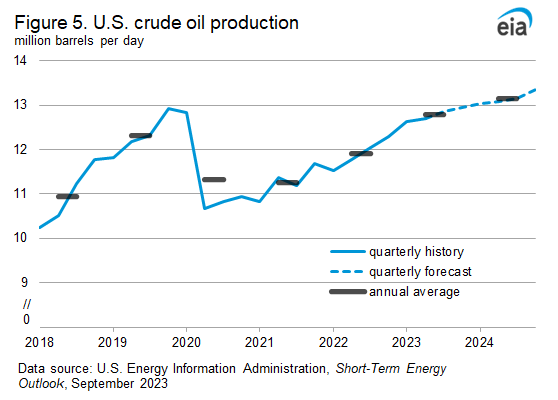
Although crude oil prices and cash from operations declined in 2Q23, E&P company capital expenditure and crude oil production both increased to their highest levels in the past three years. The West Texas Intermediate (WTI) crude oil price averaged $73.49 per barrel (b) in 2Q23, 33% ($35.44/b) less than the same quarter last year. Lower crude oil prices contributed to cash from operations declining 38% ($14.1 billion) from 2Q22 to $23.1 billion in 2Q23 (Figure 1). Capital expenditure, which historically decreases with falling crude oil prices, has been less sensitive to WTI price changes over this period: capital expenditure of $17.6 billion in 2Q23 was 37% ($4.8 billion) higher than in 2Q22. Higher capital expenditure supported crude oil production increasing 11% (421,000 b/d) from 2Q22 to 4.1 million b/d in 2Q23.
Reduced investment spending in 2021 and increased cash from operations in 2022 contributed to increased cash reserves and debt repayments that brought total debt below pre-pandemic levels. In recent quarters, E&P companies have allocated more resources toward investing activities. In 2Q23, the ratio of investing activities to cash from operations increased to 95%, higher than the 2000–23 median value of 83% (Figure 2). Some of the increased investing activity has been directed toward asset acquisitions, including:
- Ovintiv’s purchase of Midland Basin assets from EnCap Investments for $4.3 billion
- Matador Resources Company’s purchase of Delaware Basin assets from EnCap Investments for $1.6 billion
- Marathon Oil Corporation’s purchase of Eagle Ford assets from Ensign Natural Resources for $3.0 billion
- Diamondback Energy’s purchases of Midland Basin assets from Lario Permian for $1.8 billion and from FireBird Energy for $1.6 billion
These and other M&A deals, such as those by ExxonMobil and Chevron, reflect a trend toward fewer publicly traded E&P companies operating in the United States, resulting in larger companies that own more producing assets.

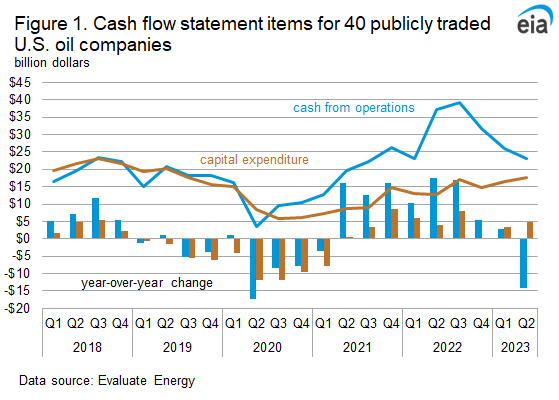
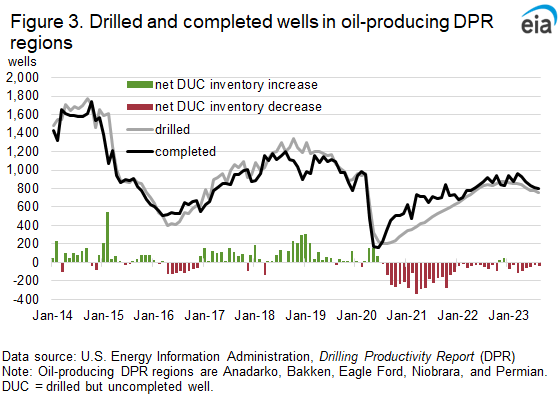
One result of increased capital expenditure is more drilled and completed wells, which U.S. producers have been keeping mostly balanced. Responding to the 2020 global oil demand contraction, E&P companies kept their costs low by drilling fewer new wells and relying more on drilled but uncompleted wells (DUCs) to maintain production levels (Figure 3). According to our Drilling Productivity Report (DPR), between August 2020 and December 2021, the net decline in DUCs averaged 214 per month, which raised a concern a low DUC count could limit crude oil production growth if the number of drilled wells per month remained low. However, increased capital expenditure has supported increased drilling activity enough to slow the net decline in DUCs, which averaged 44 in the last 18 months. The continuing decline in DUCs suggests E&P companies are still sensitive to higher-than-normal production costs and are adjusting their operations to mitigate those higher production costs, although companies have reduced the likelihood that they will run into operational constraints by improving the balance between drilled and completed wells.
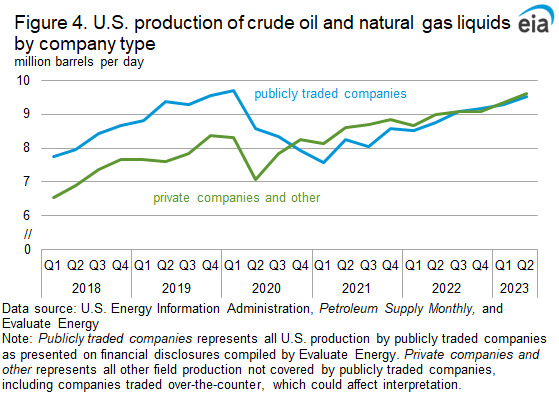
Increased production by the E&P companies underlies a broader trend of publicly traded companies increasing their share of total U.S. crude oil and NGL production. As liquid fuels markets started to recover in 2020, production from private companies grew more quickly than from publicly traded companies, resulting in private companies producing a larger share of crude oil and NGL. In recent quarters, publicly traded companies have reduced the gap and maintained production at a level effectively equal to private companies since 3Q22 (Figure 4). We totaled U.S. field production of crude oil and NGL from our Petroleum Supply Monthly and compared it with the U.S. production from all publicly traded companies—88 companies as of 2Q23, including those that have much of their production outside the United States—to estimate private company production for the past five years. In 2Q23, U.S. crude oil and NGL production from publicly traded companies was 3% higher than their collective 2019 quarterly average, and production from private companies was 22% above their 2019 quarterly average.
Higher forecast U.S. crude oil production and the drivers behind the forecast suggest capital expenditure by E&P companies will increase in the coming quarters. In our September Short-Term Energy Outlook, we forecast U.S. crude oil production will average 12.8 million b/d in 2023 and 13.2 million b/d in 2024 (Figure 5). If realized, these totals would be record highs for U.S. production. Following production cuts by Saudi Arabia and other OPEC+ members, we expect WTI crude oil prices to remain above $80/b through the end of 2024 and for the United States to be a major driver of global crude oil production growth. These factors support continued production growth for E&P companies.