Excerpted from This Week in Petroleum
Release date: June 3, 2020
On March 13, 2020, the President declared a national emergency in the United States in response to concerns regarding the 2019 novel coronavirus disease (COVID-19) outbreak. Reduced economic activity and stay-at-home orders aimed at slowing the spread of COVID-19 led to a sharp decrease in demand for petroleum products. Because refiners responded faster to reduced demand than crude oil producers, crude oil inventories increased as refinery runs fell. Despite reflecting only one-half of a month under the declared national emergency, the U.S. Energy Information Administration’s (EIA) March Petroleum Supply Monthly (PSM) data show the early effects of the COVID-19 mitigation efforts.
U.S. gross inputs into refineries fell by 670,000 barrels per day (b/d) (4.1%) from February to March to average 15.8 million b/d, the lowest monthly level since October 2015 (Figure 1). However, the refinery input decreases were not the same in every region of the United States. Gross inputs in the U.S. Gulf Coast (Petroleum Administration for Defense District, or PADD, 3), home to more than half of U.S. refining capacity, increased by 43,000 b/d (0.5%) from February to March, likely as a result of increased runs after maintenance in February. However, the year-over-year change also indicates relatively strong refinery runs in the Gulf Coast, with March 2020 runs averaging 193,000 b/d more than 2019 levels. Gross inputs in the Gulf Coast may have remained elevated compared with the U.S. average because refiners in the Gulf Coast produce petroleum products for consumption in other areas of the country and for export.
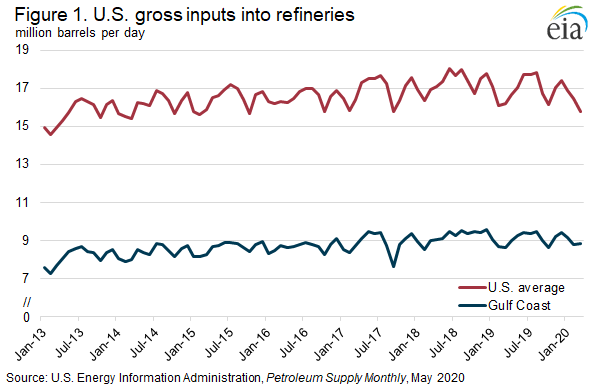
In contrast with Gulf Coast refiners, West Coast (PADD 5) refiners reacted quickly to reduce their runs. The first cases of COVID-19 in the United States were on the West Coast, which is comparatively isolated from the rest of the county’s petroleum product markets and therefore lacks the capacity to move excess product to other regions. West Coast gross inputs into refineries fell faster than the national average, dropping by 267,000 b/d (10.4%) from February to March.
U.S. crude oil production was nearly flat from February to March, falling 28,000 b/d (0.2%) to remain at 12.7 million b/d. In the wake of the COVID-19 outbreak, U.S. production remained nearly level as a result of several contributing factors, including the uncertainty about the duration and extent of reduced demand and the ability to store crude oil.
High crude oil production levels and low refinery runs forced market participants to store crude oil. From February to March, U.S. crude oil inventories increased by 28.2 million barrels (6.2%) to reach 482.5 million barrels, the third-largest month-over-month increase in EIA data going back to 1981, the beginning of the modern Petroleum Supply Reporting System. Weekly data indicate that U.S. crude oil stocks reached 52% of working capacity the last week of March. In the Midwest (PADD 2), where the crude oil storage hub of Cushing, Oklahoma, is located, crude oil inventories increased by 13.0 million barrels, the largest increase in EIA data going back to 1981, with weekly data indicating stock levels reached 52% of working capacity the last week of March. In the Gulf Coast, inventories increased by only 7.3 million barrels, likely a result of strong refinery runs, and weekly data indicate that stock levels reached 51% of working capacity the last week of March.
As stay-at-home orders and mitigation efforts took effect and limited travel in the United States, gasoline and jet fuel demand (as measured by product supplied) fell. From February to March, gasoline demand fell by 1.2 million b/d (13.2%) to 7.8 million b/d, the lowest level since January 2000 and the second-largest monthly decline on record. Weekly data (four-week rolling average) indicate that gasoline demand continued to decline to 5.3 million b/d in late April, but it has since recovered to 7.2 million b/d for the week of May 29.
During the same period, jet fuel demand fell by 242,000 b/d (14.9%), the largest single monthly change in EIA’s data going back to 1965. Weekly data (four-week average) indicate that jet fuel demand fell to a recent low of 558,000 b/d the week of May 29.
Distillate fuel demand remained near its January and February levels, falling only 98,000 b/d (2.4%) from February to March. Distillate fuel is used in many industrial and shipping activities, so distillate consumption is closely tied to economic activity, but gasoline and jet consumption are more heavily dependent on personal travel. Because of its stronger ties to economic activity, distillate consumption was initially less affected by COVID-19 mitigation efforts than gasoline and jet fuel (Figure 2). However, the latest weekly data indicate that the downturn in economic production is beginning to also effect distillate consumption. On a four-week rolling average, distillate consumption fell from 4.1 million b/d the week of March 13 (the day the national emergency was declared) to a low of 3.0 million b/d the week of May 1. Since then, demand appears to be recovering, and the four-week rolling average product supplied was 3.4 million b/d the week of May 29.