Excerpted from This Week in Petroleum, June 30, 2021
U.S. operable atmospheric crude oil distillation capacity, the primary measure of refinery capacity in the United States, totaled 18.1 million barrels per calendar day (b/cd) at the start of 2021, down 0.8 million b/cd (4.5%) from 19.0 million b/cd at the start of 2020. According to our annual Refinery Capacity Report, the last time annual refinery capacity decreased was during 2017 (Figure 1).
We measure refinery capacity in two ways: barrels per calendar day and barrels per stream day (b/sd). Calendar-day capacity is the operator’s estimate of the input that a distillation unit can process in a 24-hour period under usual operating conditions, taking into account the effects of both planned and unplanned maintenance. Stream-day capacity reflects the maximum number of barrels of input that a distillation facility can process within a 24-hour period when running at full capacity under optimal crude oil and product slate conditions with no allowance for downtime. Stream-day capacity is typically about 6% higher than calendar-day capacity.
The number of operable refineries in the United States (excluding U.S. territories), which includes both idle and operating refineries was 129 at the beginning of 2021, down from 135 at the beginning of 2020.
In 2019, the 335,000 b/cd Philadelphia Energy Solutions (PES) refinery in Philadelphia, Pennsylvania, experienced a major refinery incident that led to the refinery’s closure. Because the decision to permanently close the facility was still pending as of January 1, 2020, the facility was listed as idle in the 2020 Refinery Capacity Report. As of January 1, 2021, the refinery is considered closed and is not included in the 2021 report.
The additional refinery closures in the 2021 Refinery Capacity Report largely reflect the impact of COVID-19 on the U.S. refining sector (Figure 2). In 2020, the pandemic contributed to a substantial decrease in demand for motor fuels and refined petroleum products, which put downward pressure on refinery margins and made market conditions more challenging for refinery operators. Challenging market conditions, increasing market interest in renewable diesel production, and pre-existing plans to scale down or reconfigure petroleum refineries all contributed to the closing of a handful of refineries in 2020. We removed the following refineries from total U.S. operable capacity following their announced closures:
- The Western Refining refinery in Gallup, New Mexico: 27,000 b/cd
- The Tesoro (Marathon) refinery in Martinez, California: 161,000 b/cd
- The Dakota Prairie refinery in Dickinson, North Dakota: 19,000 b/cd
- The HollyFrontier refinery in Cheyenne, Wyoming: 48,000 b/cd
- The Shell refinery in Convent, Louisiana: 211,146 b/cd
Phillips 66 announced plans to stop refining petroleum at its 120,200-b/cd Rodeo refinery in California while it transitions to biofuels refining, but it had not terminated its refining operations as of January 1, 2021. We still consider that capacity as active in the Refinery Capacity Report.
In addition to the major refinery closures, three refinery sales took place in 2020. PBF Energy Inc. purchased the 156,400-b/cd Martinez Refinery from Royal Dutch Shell in February 2020, Hilcorp North Slope LLC purchased the 6,500-b/cd Prudhoe Bay refinery from BP in June 2020, and Hartree Partners purchased the 35,000-b/cd Channelview condensate splitter from Targa resources on January 1, 2021. We did not include sales that were announced but were not finalized as of January 1 in the 2021 Refinery Capacity Report.
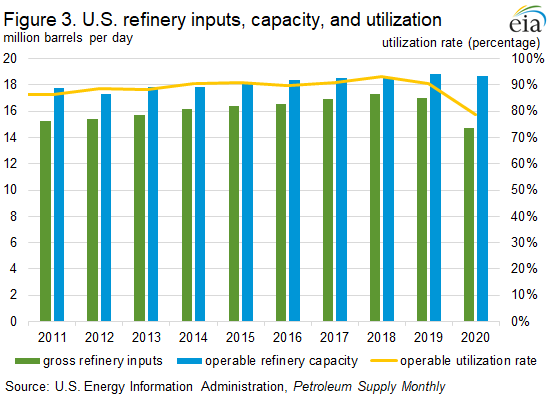
Despite reduced U.S. refinery capacity in 2020, utilization rates also decreased because of reduced crude oil inputs (Figure 3). The refinery utilization rate (represented as a percentage) measures the volume of gross refinery inputs divided by the total operable crude oil distillation capacity. Crude oil inputs to refineries—also referred to as refinery runs—dropped faster than capacity because even facilities that remained operational were pressured to reduce runs, contributing to a decrease in annual average utilization. The rate declined to an annual average of 79%, the lowest annual level since 1985.
Net inputs of crude oil to U.S. refineries averaged 14.2 million barrels per day (b/d) in 2020, the lowest annual refinery runs in more than a decade (Figure 4). In addition to reduced refinery runs, net U.S. imports and production of crude oil also decreased in 2020 compared with 2019. U.S. crude oil production averaged 11.3 million b/d in 2020, the first annual decrease since 2016 but still almost double its 2011 level.
U.S. imports of crude oil decreased by approximately 924,000 b/d in 2020 compared with 2019, totaling 1.7 million b/d less oil imported than the average of the previous five years (2015-19). This decrease in crude oil imports likely resulted from lower refinery demand for crude oil in the United States. Conversely, relatively high crude oil production despite lower refinery demand for crude oil contributed to more crude oil exports. With lower imports and higher exports, net crude oil imports (imports minus exports) decreased by 1.1 million b/d compared with 2019, averaging 3.4 million b/d less than the average of the previous five years.
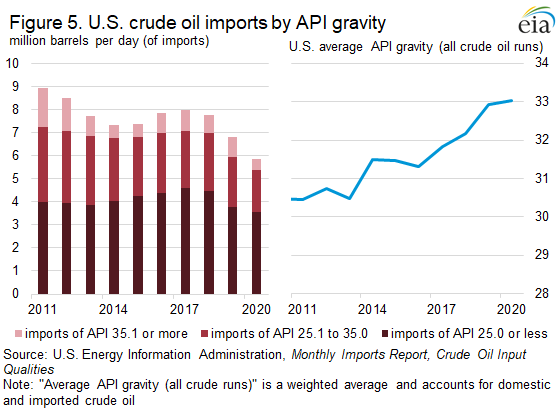
As the United States has increased domestic crude oil production over the past decade, the average density of U.S. crude oil, measured in API gravity, has become lighter. Refineries in the United States with substantial secondary conversion capacity, particularly those along the U.S. Gulf Coast (PADD 3), can process denser crude oil grades, which have a low API gravity as well as grades with higher sulfur contents. However, many U.S. refineries (particularly those in the Gulf Coast) are also geographically well positioned to take advantage of increasing U.S. domestic crude oil production. This trend has contributed to the average weighted API of U.S. crude oil inputs increasing to 33.0 in 2020, compared with 32.9 in 2019, 31.5 in 2015, and 30.4 in 2011.
When refined, lighter crude oil grades (with higher API gravity) produce larger yields of more valuable petroleum products such as gasoline, naphtha, distillates, and jet fuel. As a result, lighter crude oil grades often benefit from a price premium compared with heavier grades (lower API gravity), which produce more asphalt and residual fuel oil and tend to sell at a discount. Secondary conversion units, such as catalytic cracking, catalytic hydrocracking, and thermal cracking (or coking) units, enable refiners to transform low value residuals from heavier crude oil grades into more high-value products. West Texas Intermediate (WTI), the U.S. benchmark crude oil grade, has an API gravity of about 40, but many U.S. refiners still import discounted heavier crude oils in order to use secondary conversion units (Figure 5).
Catalytic cracking, hydrocracking, and coking capacity all decreased as of the start of 2021 relative to the 2020 Refinery Capacity Report. Their decreases range from less than 3% year-on-year for coking to more than 6% for catalytic cracking. These decreases were driven by changes in the operable secondary unit capacity of the current U.S. refinery fleet as well as lower capacity because of decommissioned secondary units from refineries that were no longer operating as of January 1, 2021.


