Distillate Demand Improving
- ULSD futures seasonal price divergence in greater detail
- Changing diesel demand statistics could shift market sentiment
- Fundamentals driving natural gas futures prices, technical resistance looms
- Dramatic shift in sources of U.S. natural gas production changes narratives
Sincerely
David Thompson, CMT
Powerhouse
(202) 333-5380

The Matrix
In the previous edition of The Energy Market Situation, we highlighted sharp divergence in the seasonal pattern of ULSD futures prices. In today’s edition, we dive deeper to find a potential cause and what that may portend for the coming months.
The ULSD Index chart below is familiar to frequent readers of The Energy Market Situation. It charts the average seasonal path of front-month ULSD prices. We do this by comparing each week to the average price for the year to give an indication of relative strength or weakness.
The April – June period highlighted in green has typically been a period of bullish price action. However, the chart in black that follows shows that this year there has been sharp divergence from the expected seasonal path.

The chart below shows the continuous front-month NYMEX ULSD futures chart. The red oval covers the same April – June time frame. The dramatic decline in price was caused in large part by an equally dramatic drop in demand as reported by the EIA (on a rolling 4-week average).
For the week ended March 22, 2024, ULSD demand was running 2.2% ahead of the comparable period in 2023. Just one month later, ULSD demand had plunged and 2024 demand was lagging 2023 by 11.6%.
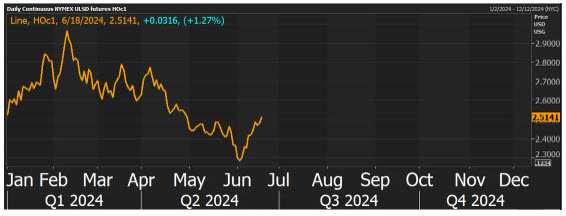
It is important for all market participants to know that the recent price rally has been supported by improving demand numbers. While still lagging year-ago levels, the gap is only 4.3% now. Should diesel demand statistics continue to recover, a resumption of the more typical seasonal price pattern is possible. This infers a return to more bullish price action through late September.
If front-month diesel futures prices pull back below $2.40/gal, then the current bullish action will have been neutralized from a technical perspective.
Marketers may wish to start reaching out to customers about protecting fuel budgets for Q3 and Q4. Please reach out to POWERHOUSE to discuss appropriate hedging strategies for your particular customer base.
Supply/Demand Balances
Supply/demand data in the United States for the week ended June 7, 2024, were released by the Energy Information Administration.
Total commercial stocks of petroleum increased (⬆) 11.5 million barrels to 1.2881 billion barrels during the week ended June 7, 2024.
Commercial crude oil supplies in the United States were higher (⬆) by 3.7 million barrels from the previous report week to 459.7 million barrels.
Crude oil inventory changes by PAD District:
PADD 1: Down (⬇) 0.3 million barrels to 8 million barrels
PADD 2: Down (⬇) 2.4 million barrels to 114.9 million barrels
PADD 3: Up (⬆) 6.1 million barrels to 266.7 million barrels
PADD 4: Down (⬇) 0.1 million barrels to 23.9 million barrels
PADD 5: Up (⬆) 0.4 million barrels to 46.2 million barrels
Cushing, Oklahoma, inventories were down (⬇) 1.6 million barrels to 33.8 million barrels.
Domestic crude oil production was up (⬆) 0.1 million barrels to 13.2 million barrels
Crude oil imports averaged 8.304 million barrels per day, a daily increase (⬆) of 1,246,000 barrels. Exports decreased (⬇) 1,313,000 barrels daily to 3.188 million barrels per day.
Refineries used 95% of capacity; 0.4 percentage point lower (⬇) than the previous report week.
Crude oil inputs to refineries decreased (⬇) 97,000 barrels daily; there were 17.047 million barrels per day of crude oil run to facilities. Gross inputs, which include blending stocks, decreased (⬇) 73,000 barrels daily to 17.511 million barrels daily.
Total petroleum product inventories increased (⬆) by 7.7 million barrels from the previous report week, up to 828.4 million barrels.
Total product demand decreased (⬇) 1,291,000 barrels daily to 19.219 million barrels per day.
Gasoline stocks increased (⬆) 2.6 million barrels from the previous report week; total stocks are 233.5 million barrels.
Demand for gasoline increased (⬆) 94,000 barrels per day to 9.04 million barrels per day.
Distillate fuel oil stocks increased (⬆) 0.9 million barrels from the previous report week; distillate stocks are at 123.4 million barrels. EIA reported national distillate demand at 3.649 million barrels per day during the report week, an increase (⬆) of 282,000 barrels daily.
Propane stocks rose (⬆) 1 million barrels from the previous report to 69.8 million barrels. The report estimated current demand at 865,000 barrels per day, an increase (⬆) of 171,000 barrels daily from the previous report week.
Natural Gas
Natural gas futures have continued in their bullish trend, abetted by the major heat wave expected to cover major East Coast population centers this weekend. The front-month contract faces nearby resistance at $3.16/mmbtu. Should the market push above that level, a test of the mid-$3.30’s would be possible.
In addition to severe heat in the Mid-Atlantic and Northeast, another weather development highlights one of the most dramatic transitions within the U.S. energy sector.
A potential tropical cyclone may form within the western Gulf of Mexico later this week. The market commentary has focused on reduced natural gas demand from relatively cooler temperatures and power outages and, notably, on the threat the storm poses to LNG exports.
Long gone are the days of Hurricane Ivan in 2004 which destroyed or damaged over 30 offshore natural gas platforms. The resulting loss of supply due to the storm saw prices more than double in the aftermath. Enter the Shale Revolution and the massive shift to onshore natural gas production and the rise of the U.S. as one of the world’s biggest LNG exporters. Now the market concerns itself with interrupted LNG exports backing up in U.S. inventories.
According to the EIA:
- Net injections into storage totaled 74 Bcf for the week ended June 7, compared with the five-year (2019–2023) average net injections of 89 Bcf and last year’s net injections of 90 Bcf during the same week. Working natural gas stocks totaled 2,974 Bcf, which is 573 Bcf (24%) more than the five-year average and 364 Bcf (14%) more than last year at this time
- According to The Desk survey of natural gas analysts, estimates of the weekly net change to working natural gas stocks ranged from net injections of 60 Bcf to 83 Bcf, with a median estimate of 72 Bcf.
- The average rate of injections into storage is 8% lower than the five-year average so far in the refill season (April through October). If the rate of injections into storage matched the five-year average of 9.0 Bcf/d for the remainder of the refill season, the total inventory would be 4,285 Bcf on October 31, which is 573 Bcf higher than the five-year average of 3,712 Bcf for that time of year.
Was this helpful? We’d like your feedback.
Please respond to [email protected]
This material has been prepared by a sales or trading employee or agent of Powerhouse Brokers, LLC and is, or is in the nature of, a solicitation. This material is not a research report prepared by Powerhouse Brokers, LLC. By accepting this communication, you agree that you are an experienced user of the futures markets, capable of making independent trading decisions, and agree that you are not, and will not, rely solely on this communication in making trading decisions.
DISTRIBUTION IN SOME JURISDICTIONS MAY BE PROHIBITED OR RESTRICTED BY LAW. PERSONS IN POSSESSION OF THIS COMMUNICATION INDIRECTLY SHOULD INFORM THEMSELVES ABOUT AND OBSERVE ANY SUCH PROHIBITION OR RESTRICTIONS. TO THE EXTENT THAT YOU HAVE RECEIVED THIS COMMUNICATION INDIRECTLY AND SOLICITATIONS ARE PROHIBITED IN YOUR JURISDICTION WITHOUT REGISTRATION, THE MARKET COMMENTARY IN THIS COMMUNICATION SHOULD NOT BE CONSIDERED A SOLICITATION.
The risk of loss in trading futures and/or options is substantial and each investor and/or trader must consider whether this is a suitable investment. Past performance, whether actual or indicated by simulated historical tests of strategies, is not indicative of future results. Trading advice is based on information taken from trades and statistical services and other sources that Powerhouse Brokers, LLC believes are reliable. We do not guarantee that such information is accurate or complete and it should not be relied upon as such. Trading advice reflects our good faith judgment at a specific time and is subject to change without notice. There is no guarantee that the advice we give will result in profitable trades.
Copyright 2024 Powerhouse Brokers, LLC, All rights reserved