WTI Crude Oil Tests $50
- A global economic slowdown is developing
- There is “large” growth in global crude oil stocks
- Global production at near-highest historical levels
- Winter 2018-19 to be firmly colder than normal

The Matrix
Thanksgiving week ended with WTI crude oil testing $50. The bullish anticipations of early October that had brought crude oil prices to $77 largely evaporated under the pressure of growing supply and slowing global demand.
The Energy Information Administration has noted “increased indications of a global economic slowdown.” Specifically, growth in China’s economy is failing expectations. Leading economic indicators have slowed for several other countries. Currency movements favoring the U.S. dollar have raised the cost of imports, adding to weakness in demand.
EIA has also noted “large” growth in global stocks. Notably, increases in U.S. crude oil production have far outpaced forecasts. The most current weekly estimate of output was 11.7 million barrels per day, well above government projections. An indication of how much new production has become available can be seen in a comparison with last year. At that time (week ending November 17, 2017) U.S. production was 9.7 million barrels daily. And at the comparable time in 2016, American crude oil production was 8.7 million daily barrels.
Russia and Saudi Arabia produced crude oil at “some of the highest levels in history” in October. This supply countered months of constrained output in Iran and Venezuela. More recently, however, the rate of decline in Venezuelan production has slowed. The country has added to exports. Libya has also added to output at a more rapid rate than expected. The country has reportedly produced more than one million barrels per day for two months in a row.
OPEC and other producer nations are responding by entering discussions on production cuts of around 1.4 million barrels daily. This could initiate a price rally.
Producers in the United States could particularly benefit from such a move. Domestic suppliers have become very efficient. Break-even prices have been estimated to be around $36 per barrel in West Texas and $43 in North Dakota. So the OPEC effort to support prices could encourage even more U.S. output, frustrating its attempt to raise prices.
Supply/Demand Balances
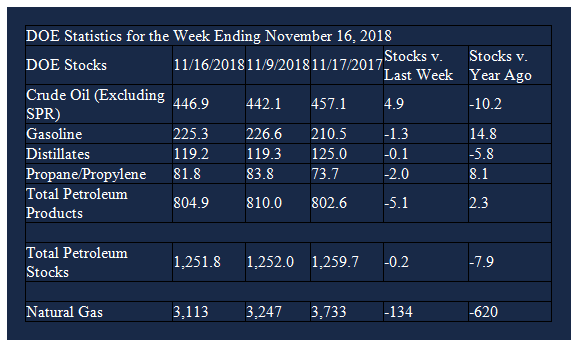
Supply/demand data in the United States for the week ending November 16, 2018 were released by the Energy Information Administration.
Total commercial stocks of petroleum decreased 0.2 million barrels during the week ending November 16, 2018.
There were draws in stocks of gasoline, K-jet fuel, distillates, fuel ethanol, propane, and other oils. There were builds in stocks of crude oil and residual fuel oil.
Commercial crude oil supplies in the United States increased to 446.9 million barrels, a build of 4.9 million barrels.
Crude oil supplies increased in four of the five PAD Districts. PAD District 1 (East Coast) stocks increased 1.0 million barrels, PADD 3 (Gulf Coast) stocks grew 3.4 million barrels, and PADD 4 (Rockies) stocks were up 0.6 million barrels. PADD 5 (West Coast) stocks added 0.6 million barrels. PADD 2 (Midwest) stocks fell 0.7 million barrels.
Cushing, Oklahoma inventories decreased 0.2 million barrels from the previous report week to 35.3 million barrels.
Domestic crude oil production was unchanged from the previous report week at 11.7 million barrels per day.
Crude oil imports averaged 7.554 million barrels per day, a daily increase of 102,000 barrels per day. Exports fell 81,000 barrels daily to 1.969 million barrels per day.
Refineries used 92.7 per cent of capacity, an increase of 2.6 percentage points from the previous report week.
Crude oil inputs to refineries increased 423,000 barrels daily; there were 16.855 million barrels per day of crude oil run to facilities. Gross inputs, which include blending stocks, increased 480,000 barrels daily to 17,245 million barrels daily.
Total petroleum product inventories fell 5.1 million barrels from the previous report week.
Gasoline stocks decreased 1.3 million barrels from the previous report week; total stocks are 225.3 million barrels.
Demand for gasoline decreased 7,000 barrels per day to 9.185 million barrels per day.
Total product demand fell 1.123 million barrels daily to 21.264 million barrels per day.
Distillate fuel oil stocks decreased 0.1 million barrels from the previous report week; distillate stocks are 119.2 million barrels. National distillate demand was reported at 4.270 million barrels per day during the report week. This was a weekly decrease of 363,000 barrels daily.
Propane stocks decreased 2.0 million barrels from the previous report week; propane stock are 81.8 million barrels. Current demand is estimated at 1.253 million barrels per day, a decrease of 293,000 barrels daily from the previous report week.
Natural Gas
According to the EIA:
Working gas in storage was 3,113 Bcf as of Friday, November 16, 2018, according to EIA estimates. This represents a net decrease of 134 Bcf from the previous week. Stocks were 620 Bcf less than last year at this time and 710 Bcf below the five-year average of 3,823 Bcf. At 3,113 Bcf, total working gas is below the five-year historical range.

Natural Gas Underground Storage 5-year Trend 2015-2018 Source: EIA
Natural gas prices are notably sensitive to weather. One analysis of weather impacts this year pointed out that “2018 has been a year of weather extremes in the U.S., including the coldest April in 35 years, the hottest May-September on record, and the first colder-than-normal October in 9 years. … In aggregate, the current November-March outlook calls for 3,866 gas-weighted heating degree days placing Winter 2018-19 firmly colder than both the 10- and 30-year normal. A persistent high pressure system near Alaska and low sun spot activity (“Solar Minimum”) are contributing factors to the cold weather.”
Futures trading involves significant risk and is not suitable for everyone. Transactions in securities futures, commodity and index futures and options on future markets carry a high degree of risk. The amount of initial margin is small relative to the value of the futures contract, meaning that transactions are heavily “leveraged”. A relatively small market movement will have a proportionately larger impact on the funds you have deposited or will have to deposit: this may work against you as well as for you. You may sustain a total loss of initial margin funds and any additional funds deposited with the clearing firm to maintain your position. If the market moves against your position or margin levels are increased, you may be called upon to pay substantial additional funds on short notice to maintain your position. If you fail to comply with a request for additional funds within the time prescribed, your position may be liquidated at a loss and you will be liable for any resulting deficit. Past performance may not be indicative of future results. This is not an offer to invest in any investment program.
Powerhouse is a registered affiliate of Coquest, Inc.
Was this helpful? We’d like your feedback.
Please respond to [email protected]
Copyright© 2018 Powerhouse, All rights reserved.