Oil Prices Could Turn Bullish
- U.S. crude oil supplies fell 4.7 million barrels
- U.S. gasoline supplies rose 5.5 million barrels
- Futures prices broke resistance
- Libya declares force majeure
- Natural gas prices lose ground

Alan Levine—Chairman, Powerhouse
(202) 333-5380
The Matrix
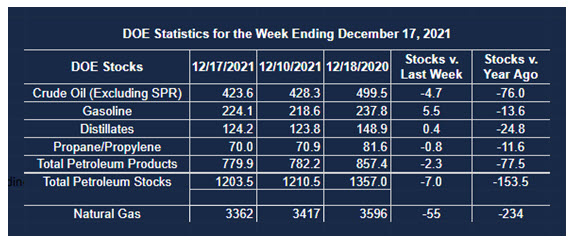
The U.S. Petroleum Balance Sheet for the week ended Dec. 17, 2021, reported declining stocks of crude oil offset in part by a larger-than-expected increase in gasoline supplies. Crude oil availability fell 4.7 million barrels for the week. The decline was seen on the Gulf Coast (-3.3 million barrels) and on the West Coast (-1.7 million barrels.)
Gasoline inventories gained 5.5 million barrels for the week. Analysts expected an increase of only 600,000 barrels. It was not enough, however, to shift the bullish tone of the report.
Oil stocks lost seven million barrels overall. Loss of 6.7 million barrels of Other Oils well offset the bearish effect of gasoline gains.
The price effect of these data was immediate. Prices for both crude oil and product futures moved higher. Crude oil closed out the shortened pre-Christmas trading week at $73.79, 1.4% higher on the day. The price is now approaching $76.84, next resistance at the bottom of a range traded since September. (The top of that range is $85.41, seen on October 25, 2021.)
Product prices joined the rally. ULSD is now well into prices seen in autumn, ending the week at $2.0461. (Prices reached their autumn high of $2.6080 in October. Gasoline finished the week at $2.2061 gaining over two cents despite the unusual increase in inventories.)
The charts for RBOB and ULSD have broken the downtrend that had been in place since mid-October. If the technical bulls continue to drive the markets, then the pre-Thanksgiving price levels become the next resistance levels, $2.39 for HO and $2.35 for RBOB. WTI crude oil has not yet confirmed the technical shift to a bullish posture on the charts.
North Africa is, once again, facing geopolitical uncertainty. Libyan militias have stopped about 300,000 barrels per day of production, including the significant Sharara field. The Libyan National Oil Company has declared force majeure. No restart date has been announced.
Another bullish statistic comes from OPEC+ The group was reportedly 117% compliant with its November cuts. The group provided less crude oil than planned.
Supply/Demand Balances
Supply/demand data in the United States for the week ended Dec. 17, 2021 were released by the Energy Information Administration.
Total commercial stocks of petroleum fell 7.0 million barrels during the week ended Dec. 17, 2021.
Commercial crude oil supplies in the United States decreased by 4.7 million barrels from the previous report week to 423.6 million barrels.
Crude oil inventory changes by PAD District:
PADD 1: Down 0.3 million barrels to 7.6 million barrels
PADD 2: Plus 0.2 million barrels to 113.7 million barrels
PADD 3: Down 3.3 million barrels to 230.8 million barrels
PADD 4: Plus 0.3 million barrels to 24.1 million barrels
PADD 5: Down 1.7 million barrels to 46.8 million barrels
Cushing, Oklahoma, inventories were up 1.5 million barrels from the previous report week to 33.7 million barrels.
Domestic crude oil production was down 100,000 barrels per day from the previous report week to 11.6 million barrels daily.
Crude oil imports averaged 6.194 million barrels per day, a daily decrease of 277,000 barrels. Exports decreased 766,000 barrels daily to 2.879 million barrels per day.
Refineries used 89.6% of capacity; down 0.2% from the previous report week.
Crude oil inputs to refineries increased 148,000 barrels daily; there were 15.818 million barrels per day of crude oil run to facilities. Gross inputs, which include blending stocks, fell 38,000 barrels daily to 16.242 million barrels daily.
Total petroleum product inventories fell 2.3 million barrels from the previous report week.
Gasoline stocks increased 5.5 million barrels from the previous report week; total stocks are 224.1 million barrels.
Demand for gasoline fell by 486,000 barrels per day to 8.986 million barrels per day.
Total product demand decreased 2,737,000 barrels daily to 20.454 million barrels per day.
Distillate fuel oil stocks increased 0.4 million barrels from the previous report week; distillate stocks are at 124.2 million barrels. EIA reported national distillate demand at 3.822 million barrels per day during the report week, a decrease of 1.074 million barrels daily.
Propane stocks decreased 0.8 million barrels from the previous report week; propane stocks are at 70.0 million barrels. The report estimated current demand at 1.193 million barrels per day, a decrease of 866,000 barrels daily from the previous report week.
Natural Gas
The effect of European strength in natural gas prices fell apart on the last day of trading before the Christmas break. The rally that seemed ready to challenge $4.00 and possibly reach $4.50 was caught up short in the EIA report that showed long-term storage moving to a surplus. Prices fell to $3.60 on Thursday before settling at $3.73. Warm weather forecasts for major U.S. natural gas markets reduce the likelihood of a significant advance, at least in the near term.
According to the EIA:
Working gas in storage was 3,362 Bcf as of Friday, Dec. 17, 2021, according to EIA estimates. This represents a net decrease of 55 Bcf from the previous week. Stocks were 234 Bcf less than last year at this time and 34 Bcf above the five-year average of 3,328 Bcf. At 3,362 Bcf, total working gas is within the five-year historical range.
Was this helpful? We’d like your feedback.
Please respond to [email protected]
Powerhouse Futures & Trading Disclaimer
Copyright 2021 Powerhouse Brokerage, LLC, All rights reserved