


Large Oil Inventories Not Enough To Ease Short Supply Worries
- Crude oil production reached eleven million barrels
- Oil supply augmented by Strategic Petroleum Reserves
- Oil demand growth holding up
- LNG futures contract under development
Sincerely,
Alan Levine, Chairman
POWERHOUSE
(202) 333-5380
The Matrix
News stories fueled by headlines like, “Permian Basin oil boom creates labor shortage,” or “US shale oil output surges,” have been easy to come by in recent years. US oil production has reached eleven million barrels daily well before official sources projected that level.
The US has 660 million barrels of crude oil available in the Strategic Petroleum Reserve (SPR.) There are also strategic reserves held in other countries. One estimate puts more than four billion barrels in various reserves globally. There is also room for expansion of current production in Russia and Saudi Arabia among other, lesser, producers.
Concerns of an impending petroleum shortage persist, notwithstanding the large volume of potential supply currently available. Analysts point out that increases in Saudi Arabia are offsetting declining output in other oil provinces. Apart from natural decline, uncertainty and instability are eating into any surplus availability. In particular the market has been watching Venezuela, Nigeria, Libya, Iraq and Iran.

Distillate Fuel Oil Stocks 5-year Chart ending July 7, 2018 Source: EIA, POWERHOUSE
The industry had been worried about demand peaking. The advent of electric vehicles and the remarkable expansion of supply from renewable sources were seen as grabbing share from traditional supply. These are more likely medium-term problems. In reality, however, near-term demand has held up, straining current supplies. Recently, annual global demand growth has pushed 1.5 million barrels daily.
The attraction of lower-cost fracturing has blown a hole in traditional project investment and exploration spending. This sets up the possibility that longer-term supplies may be inhibited as shale plays play out, reflecting more rapid decline curves.
In Texas, production growth is reportedly slowing. Infrastructure to carry crude oil to coastal Texas from the Permian is short, and new offtake pipelines are about a year away. On completion, supplies will rapidly be sent to refining centers. This should ease concerns about availability, but not yet this year adding to the bullish view of the market.
Supply/Demand Balances
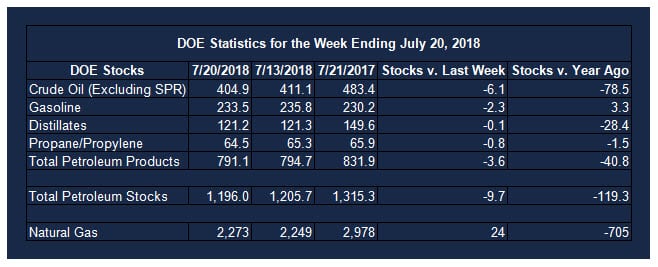
Supply/demand data in the United States for the week ending July 20, 2018 were released by the Energy Information Administration.
Total commercial stocks of petroleum fell 9.7 million barrels during the week ending July 20, 2018.
There were draws in stocks of gasoline, fuel ethanol, K-jet fuel, distillate fuel oil, and propane. There were builds in stock of residual fuel and other oils.
Commercial crude oil supplies in the United States decreased to 404.9 million barrels, a draw of 6.1 million barrels.
Crude oil supplies decreased in all five PAD Districts. PAD District 1 (East Coast) crude oil stocks fell 0.7 million barrels, PADD 2 (Midwest) crude stocks declined 0.7 million barrels, PADD 3 (Gulf Coast) stocks retreated 0.1 million barrels, PADD 4 (Rockies) stocks decreased 0.2 million barrels, and PADD 5 (West Coast) stocks fell 4.5 million barrels.
Cushing, Oklahoma inventories decreased 1.2 million barrels from the previous report week to 23.7 million barrels.
Domestic crude oil production was unchanged from the previous report week at 11.0 million barrels per day.
Crude oil imports averaged 7.770 million barrels per day, a daily decrease of 1.296 million barrels per day. Exports increased 1.222 million barrels daily to 2.683 million barrels per day.
Refineries used 93.8 per cent of capacity, a decrease of 0.5 percentage points from the previous report week.
Crude oil inputs to refineries increased 46,000 barrels daily; there were 17.285 million barrels per day of crude oil run to facilities. Gross inputs, which include blending stocks, fell 85,000 barrels daily to 17.285 million barrels daily.
Total petroleum product inventories saw a decrease of 3.6 million barrels from the previous report week.
Gasoline stocks decreased 2.3 million barrels from the previous report week; total stocks are 233.5 million barrels.
Demand for gasoline increased 138,000 barrels per day to 9.846 million barrels per day.
Total product demand increased 399,000 barrels daily to 21.700 million barrels per day.
Distillate fuel oil stocks decreased 0.1 million barrels from the previous report week; distillate stocks are 121.2 million barrels. National distillate demand was reported at 4.167 million barrels per day during the report week. This was a weekly increase of 26,000 barrels daily.
Propane stocks declined 0.8 million barrels from the previous report week; propane stock are 64.5 million barrels. Current demand is estimated at 1.093 million barrels per day, an increase of 63,000 barrels daily from the previous report week.
Natural Gas
Liquefaction of natural gas is become more attractive economically at a time when US natural gas production is expanding. Indeed, exports of liquefied natural gas (LNG) are slated to grow dramatically and American natural gas is becoming significant internationally. This raises the question of how best to price LNG.
Traditionally, global natural gas was priced with reference to Brent crude. Now, however, markets are looking to Henry Hub as a central price point. This represents a significant shift in pricing practice and suggests the value of a potential LNG futures contract. As noted (Energy Market Situation, July 16, 2018), the CME is developing such a contract now, with delivery at the Sabine Pass terminal.
According to the Energy Information Administration:
Net injections [of natural gas] fell lower than the five-year average for the fourth week in a row. Net injections into storage totaled 24 Bcf for the week ending July 20, compared with the five-year (2013–17) average net injections of 46 Bcf and last year’s net injections of 19 Bcf during the same week. Working gas stocks totaled 2,273 Bcf and are now 557 Bcf lower than the five-year average and 705 Bcf lower than last year at this time.

Natural Gas Underground Storage 5-year Chart, July 2018 Source: EIA
Working gas stocks are on pace to end the refill season lower than the five-year range. Net injections into storage are 19% lower than the five-year average rate so far in the 2018 refill season. If working gas stocks match the five-year average rate of injections of 9.6 Bcf/d for the remainder of the refill season, inventories will total 3,258 Bcf on October 31, almost 300 Bcf lower than the five-year low of 3,560 Bcf.
Futures trading involves significant risk and is not suitable for everyone. Transactions in securities futures, commodity and index futures and options on future markets carry a high degree of risk. The amount of initial margin is small relative to the value of the futures contract, meaning that transactions are heavily “leveraged”. A relatively small market movement will have a proportionately larger impact on the funds you have deposited or will have to deposit: this may work against you as well as for you. You may sustain a total loss of initial margin funds and any additional funds deposited with the clearing firm to maintain your position. If the market moves against your position or margin levels are increased, you may be called upon to pay substantial additional funds on short notice to maintain your position. If you fail to comply with a request for additional funds within the time prescribed, your position may be liquidated at a loss and you will be liable for any resulting deficit. Past performance may not be indicative of future results. This is not an offer to invest in any investment program.
Powerhouse is a registered affiliate of Coquest, Inc.
Was this helpful? We’d like your feedback.
Please respond to [email protected]
Copyright © 2018 Powerhouse, All rights reserved.


