Nothing is as easy as it seems; but that’s a good thing
- Colder than average winter weather a possibility
- Bullish geopolitical developments dominate headlines
- OPEC+ supply decisions carry more sway with markets at present
- Uncertainty breeds opportunity for energy marketers
Sincerely,
David Thompson, CMT
Executive Vice President
Powerhouse
(202) 333-5380
The Matrix
NOAA’s Climate Prediction Center currently assesses that the U.S. is in a La Nina period. The broad generalization posits that La Nina will likely lead to the possibility of colder and stormier weather in the northern U.S. A major bank recently argued that while the old rule of thumb about La Nina isn’t as simple as it seems, this winter could be colder than the last two years.
Israel’s killing of the leader of Hezbollah would seem to be major escalations of its conflict with Iran. Developments such as this which bring the potential of military strikes against oil infrastructure more likely are typically bullish for the energy markets.
China has implemented a $284 billion dollar stimulus measure aimed at putting more money into the hands of consumers and reducing local government debt loads.
Despite this convergence of seemingly bullish factors, petroleum prices have failed to break the downtrend that has been in force since early July. The driving factor for the bearish sentiment still gripping that market is belief that OPEC will bring more crude oil supply to the market to defend their market share. Press reports have indicated that Saudi Arabia is ready to abandon its price target of $100 per barrel. OPEC spare oil production capacity remains robust at just over 6 million barrels per day available should the Kingdom wish to pressure non-OPEC oil producers.
Energy marketers should view uncertainty as one of their best marketing tools. When conflicting headlines dominate the news, customers often avoid committing to purchases because of FOMO on lower prices. Marketers can address this concern with an option strategy. You can protect your customers from higher prices but offer them the ability to participate if prices move lower.
Customers always care about price. But it’s not always about the price ‘right now’. Sometimes it’s what the price might be in a few weeks that matters more. Contact POWERHOUSE to discuss price protection strategies for your customers.
Supply/Demand Balances
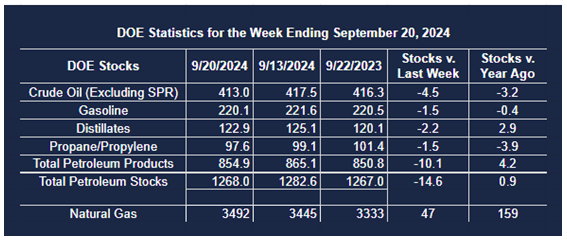
Supply/demand data in the United States for the week ended September 20, 2024, were released by the Energy Information Administration.
Total commercial stocks of petroleum decreased (⬇) 14.6 million barrels to 1.2680 billion barrels during the week ended September 20th, 2024.
Commercial crude oil supplies in the United States were lower (⬇) by 4.5 million barrels from the previous report week to 413.0 million barrels.
Crude oil inventory changes by PAD District:
PADD 1: Up (⬆) 0.1 million barrels to 8.1 million barrels
PADD 2: Up (⬆) 2.9 million barrels to 102.4 million barrels
PADD 3: Down (⬇) 6.3 million barrels to 234.5 million barrels
PADD 4: Down (⬇) 0.1 million barrels to 22.0 million barrels
PADD 5: Down (⬇) 1.1 million barrels to 46.1 million barrels
Cushing, Oklahoma, inventories were up (⬆) 0.1 million barrels to 22.8 million barrels.
Domestic crude oil production remained unchanged (=) at 13.2 million barrels per day.
Crude oil imports averaged 6.456 million barrels per day, a daily increase (⬆) of 135,000 barrels. Exports decreased (⬇) 692,000 barrels daily to 3.897 million barrels per day.
Refineries used 90.9% of capacity; a decrease (⬇) of 1.2% from the previous report week.
Crude oil inputs to refineries decreased (⬇) 124,000 barrels daily; there were 16.353 million barrels per day of crude oil run to facilities. Gross inputs, which include blending stocks, decreased (⬇) 218,000 barrels daily to 16.659 million barrels daily.
Total petroleum product inventories decreased (⬇) by 10.1 million barrels from the previous report week, up to 855 million barrels.
Total product demand increased (⬆) 1,593,000 barrels daily to 21.386 million barrels per day.
Gasoline stocks remained decreased (⬇) 1.5 million barrels from the previous report week; total stocks are 220.1 million barrels.
Demand for gasoline increased (⬆) 429,000 barrels per day to 9.205 million barrels per day.
Distillate fuel oil stocks decreased (⬇) 2.2 million barrels from the previous report week; distillate stocks are at 122.9 million barrels. EIA reported national distillate demand at 4.022 million barrels per day during the report week, an increase (⬆) of 224,000 barrels daily.
Propane stocks fell (⬇) 1.5 million barrels from the previous report to 97.6 million barrels. The report estimated current demand at 1,332,000 barrels per day, an increase (⬆) of 725,000 barrels daily from the previous report week.
Natural Gas
Front-month natural gas futures smashed through the technical target we identified last week. With this development, the next resistance zone for prompt Henry Hub futures is the June high watermark at $3.159.
The previously mentioned bank research suggests that if a colder-than-last-year winter materializes, a bull case scenario could take winter prices over $4.50 per MMBtu on average. A parallel to the oil market is crucial to keep in mind, however. Should U.S. shale producers mimic OPEC+ and bring more supply to market, the most bullish technical projections can quickly collapse.
From the EIA:
- Working gas stocks increased 47 Bcf for the week ended September 20, compared with the five-year (2019–2023) average net injections of 88 Bcf and last year’s net injections of 82 Bcf during the same week. Working natural gas stocks totaled 3,492 Bcf, which is 233 Bcf (7%) more than the five-year average and 159 Bcf (5%) more than last year at this time.
- This week’s report included a reclassification totaling 8 Bcf from working natural gas storage to base gas. Reclassifications are non-flow adjustments to working gas levels based on an accounting or engineering assessment of the facility’s operational capabilities. This week’s reclassification reduced working gas stocks by 8 Bcf for the week ended September 20. The implied flows — excluding the effect of the reclassification — into working gas storage totaled 55 Bcf during the report week.
- According to The Desk survey of natural gas analysts, estimates of the weekly net change to working natural gas stocks ranged from net injections of 45 Bcf to 59 Bcf, with a median estimate of 54 Bcf.
- The average rate of injections into storage is 25% lower than the five-year average so far in the refill season (April through October). If the rate of injections into storage matched the five-year average of 11.1 Bcf/d for the remainder of the refill season, the total inventory would be 3,945 Bcf on October 31, which is 233 Bcf higher than the five-year average of 3,712 Bcf for that time of year.
Was this helpful? We’d like your feedback.
Please respond to [email protected]
This material has been prepared by a sales or trading employee or agent of Powerhouse Brokers, LLC and is, or is in the nature of, a solicitation. This material is not a research report prepared by Powerhouse Brokers, LLC. By accepting this communication, you agree that you are an experienced user of the futures markets, capable of making independent trading decisions, and agree that you are not, and will not, rely solely on this communication in making trading decisions.
DISTRIBUTION IN SOME JURISDICTIONS MAY BE PROHIBITED OR RESTRICTED BY LAW. PERSONS IN POSSESSION OF THIS COMMUNICATION INDIRECTLY SHOULD INFORM THEMSELVES ABOUT AND OBSERVE ANY SUCH PROHIBITION OR RESTRICTIONS. TO THE EXTENT THAT YOU HAVE RECEIVED THIS COMMUNICATION INDIRECTLY AND SOLICITATIONS ARE PROHIBITED IN YOUR JURISDICTION WITHOUT REGISTRATION, THE MARKET COMMENTARY IN THIS COMMUNICATION SHOULD NOT BE CONSIDERED A SOLICITATION.
The risk of loss in trading futures and/or options is substantial and each investor and/or trader must consider whether this is a suitable investment. Past performance, whether actual or indicated by simulated historical tests of strategies, is not indicative of future results. Trading advice is based on information taken from trades and statistical services and other sources that Powerhouse Brokers, LLC believes are reliable. We do not guarantee that such information is accurate or complete and it should not be relied upon as such. Trading advice reflects our good faith judgment at a specific time and is subject to change without notice. There is no guarantee that the advice we give will result in profitable trades.
Copyright 2024 Powerhouse Brokers, LLC, All rights reserved