Rift Between Interest Groups Comes to the Fore
- EPA announces imminent decision of RVO reallocation
- Wildly varying possibilities suggested
- Previous alignment between Big Oil and Big Ag appears fractured now
- Record winter natural gas demand balanced by supply growth
Sincerely,
David Thompson, CMT
Executive Vice President
Powerhouse
(202) 333-5380

The Matrix
The unusual and perhaps untenable working relationship between Big Oil and Big Ag may soon be reaching a breaking point. A month ago, the EPA ruled on 175 Small Refinery Exemption (SRE) petitions. The vast majority of the requests were fully or partially granted.
The pool of Renewable Volume Obligations previously assigned to smaller refiners must now be reallocated to larger refiners. On August 22, the EPA stated that “in the near future” it would submit a proposed rule for the reallocations. The EPA then said it may consider reallocating either 100% of the volume or 50%. Subsequently, proposals of either 75%, 25% or 0% have been suggested.
Not unsurprisingly, the two lobby groups have divergent views on the proposals. The president of the American Fuel & Petrochemicals Manufacturers said, “Piling on more than a billion gallons in additional, reallocated mandates will do nothing other than increase imports, harm U.S. energy dominance and cost consumers.”
While the head of biofuels trade group Growth Energy stated, “Full reallocation of exempt gallons is a surefire way to drive income to America’s rural communities.”
The nuances of the eventual ruling on this issue are likely to have significant impact on RIN values. This should, in turn, have an important effect on wholesale RBOB and diesel prices.
POWERHOUSE will keep our readers updated as this story develops in the coming weeks.
Supply/Demand Balances
Supply/demand data in the United States for the week ended September 12, 2025, were released by the Energy Information Administration.
Total commercial stocks of petroleum increased (⬆) 1.2 million barrels to 1.2824 billion barrels during the week ended September 12th, 2025.
Commercial crude oil supplies in the United States were lower (⬇) by 9.3 million barrels from the previous report week to 415.4 million barrels.
Crude oil inventory changes by PAD District:
PADD 1: Up (⬆) 0.2 million barrels to 7.4 million barrels
PADD 2: Down (⬇) 1.1 million barrels to 103.0 million barrels
PADD 3: Down (⬇) 7.5 million barrels to 237.4 million barrels
PADD 4: Unchanged (=) at 22.6 million barrels
PADD 5: Down (⬇) 0.9 million barrels 45.0 million barrels
Cushing, Oklahoma, inventories were down (⬇) 0.3 million barrels to 23.6 million barrels.
Domestic crude oil production decreased (⬇) 13,000 barrels per day from the previous report to 13.482 million barrels per day.
Crude oil imports averaged 5.692 million barrels per day, a daily decrease (⬇) of 579,000 barrels. Exports increased (⬆) 2,532,000 barrels daily to 5.277 million barrels per day.
Refineries used 93.3% of capacity; a decrease (⬇) of 1.6% from the previous report week.
Crude oil inputs to refineries decreased (⬇) 394,000 barrels daily; there were 16.424 million barrels per day of crude oil run to facilities. Gross inputs, which include blending stocks, decreased (⬇) 291,000 barrels daily to 16.939 million barrels daily.
Total petroleum product inventories increased (⬆) by 10.3 million barrels from the previous report week, up to 867.0 million barrels.
Total product demand increased (⬆) 856,000 barrels daily to 20.637 million barrels per day.
Gasoline stocks decreased (⬇) 2.3 million barrels from the previous report week; total stocks are 217.6 million barrels.
Demand for gasoline increased (⬆) 302,000 barrels per day to 8.810 million barrels per day.
Distillate fuel oil stocks increased (⬆) 4.0 million barrels from the previous report week; distillate stocks are at 124.7 million barrels. EIA reported national distillate demand at 3.621 million barrels per day during the report week, an increase (⬆) of 244,000 barrels daily.
Propane stocks rose (⬆) 1.3 million barrels from the previous report to 98.9 million barrels. The report estimated current demand at 852,000 barrels per day, a decrease (⬇) of 15,000 barrels daily from the previous report week.
Natural Gas
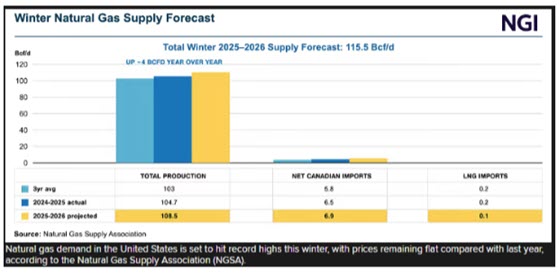
The Natural Gas Supply Association published their seasonal outlook yesterday. It forecasts that natural gas demand in the U.S. will hit record highs this winter but will be countered by a surge in domestic natural gas production. During last year’s winter, the U.S. produced 104.7 bcf/d of gas. This year the association expects that figure to reach 108.5 bcf/d.
According to the EIA:
- Net injections into storage totaled 90 Bcf for the week ended September 12, compared with the five-year (2020–24) average net injections of 74 Bcf and last year’s net injections of 56 Bcf during the same week. Working natural gas stocks totaled 3,433 Bcf, which is 204 Bcf (6%) more than the five-year average and 4 Bcf (less than 1%) lower than last year at this time.
- According to The Desk survey of natural gas analysts, estimates of the weekly net change to working natural gas stocks ranged from net injections of 70 Bcf to 88 Bcf, with a median estimate of 81 Bcf.
- The average rate of injections into storage is 19% higher than the five-year average so far in the refill season (April through October). If the rate of injections into storage matched the five-year average of 10.7 Bcf/d for the remainder of the refill season, the total inventory would be 3,957 Bcf on October 31, which is 204 Bcf higher than the five-year average of 3,753 Bcf for that time of year.
Was this helpful? We’d like your feedback.
Please respond to [email protected]
This material has been prepared by a sales or trading employee or agent of Powerhouse Brokers, LLC and is, or is in the nature of, a solicitation. This material is not a research report prepared by Powerhouse Brokers, LLC. By accepting this communication, you agree that you are an experienced user of the futures markets, capable of making independent trading decisions, and agree that you are not, and will not, rely solely on this communication in making trading decisions.
DISTRIBUTION IN SOME JURISDICTIONS MAY BE PROHIBITED OR RESTRICTED BY LAW. PERSONS IN POSSESSION OF THIS COMMUNICATION INDIRECTLY SHOULD INFORM THEMSELVES ABOUT AND OBSERVE ANY SUCH PROHIBITION OR RESTRICTIONS. TO THE EXTENT THAT YOU HAVE RECEIVED THIS COMMUNICATION INDIRECTLY AND SOLICITATIONS ARE PROHIBITED IN YOUR JURISDICTION WITHOUT REGISTRATION, THE MARKET COMMENTARY IN THIS COMMUNICATION SHOULD NOT BE CONSIDERED A SOLICITATION.
The risk of loss in trading futures and/or options is substantial and each investor and/or trader must consider whether this is a suitable investment. Past performance, whether actual or indicated by simulated historical tests of strategies, is not indicative of future results. Trading advice is based on information taken from trades and statistical services and other sources that Powerhouse Brokers, LLC believes are reliable. We do not guarantee that such information is accurate or complete and it should not be relied upon as such. Trading advice reflects our good faith judgment at a specific time and is subject to change without notice. There is no guarantee that the advice we give will result in profitable trades.
Copyright 2025 Powerhouse Brokers, LLC, All rights reserved