

Refining Margins Under Pressure
- The boom time for refiners is over
- Global refining capacity expanding while demand is falling
- Natural gas prices holding above $2.00
Sincerely
Elaine Levin,
President
Powerhouse
(202) 333-5380
The Matrix
Commodities, by nature, are cyclical. When prices are high, the boom times encourage new production. Ultimately, the best cure for high prices is high prices. The resulting new production ushers in the bust. Capex spending falls, and the cycle starts again. During the pandemic, refineries shuttered as margins declined. The invasion of Ukraine by Russia and the subsequent boycotts of Russian-made petroleum products caught the market short. Crack spreads hit record highs. Since then, we have seen an expansion of refining capacity at home and worldwide. With global demand falling, run cuts could be more extensive for the fall turnaround season.
Refiners experienced outsized profit margins during the boom of 2022-2023. The world was short diesel. Distillate crack spreads traded over $50.00 a barrel for most of 2022 and averaged close to $40 per barrel in 2023.
New refining capacity was announced worldwide. Facilities producing over 600,000 barrels a day were being constructed in places like Kuwait and Nigeria. Saudi Arabia, Oman, and China also added to capacity. In the U.S., existing refineries were expanded. The next refining boom was underway.
Last week, U.S. refineries ran at 93.3% of capacity, which is high for early September. A quiet hurricane season has caused little issue, at least so far. Hurricane Francine may have some impact from power outages, but a direct hit of major refining centers is not expected. Product inventories are rebuilding at a time when global demand is falling. As refiners’ profit margins decline, bank analysts warn about the sector. Run cuts normally follow. Given the calendar, scheduled maintenance could be expanded to more significant reductions in output.
At this time of year, diesel prices usually are making their seasonal run higher. During fall maintenance, demand typically picks up. Harvest begins. Construction projects try to get ahead of winter weather. On-road diesel usage peaks in October as retailers prepare for the holiday. Yet prices are falling. Demand woes from China, growing U.S. crude oil production, and growing OPEC spare capacity are the headlines of the day. It remains to be seen if this year’s fall turnaround will have the power to offset the bearish tide.
Supply/Demand Balances
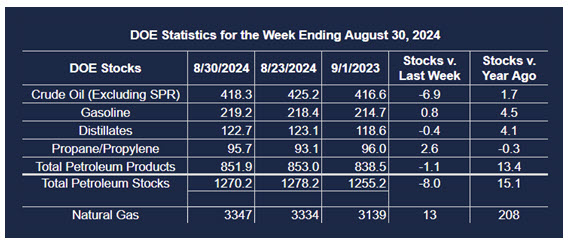
Supply/demand data in the United States for the week ended August 30, 2024, were released by the Energy Information Administration.
Total commercial stocks of petroleum decreased (⬇) 8 million barrels to 1.2702 billion barrels during the week ended August 30th, 2024.
Commercial crude oil supplies in the United States were lower (⬇) by 6.9 million barrels from the previous report week to 418.3 million barrels.
Crude oil inventory changes by PAD District:
PADD 1: Down (⬇) 1.1 million barrels to 7.7 million barrels
PADD 2: Down (⬇) 1.0 million barrels to 104.1 million barrels
PADD 3: Down (⬇) 5.8 million barrels to 234.4 million barrels
PADD 4: Up (⬆) 0.3 million barrels to 22.4 million barrels
PADD 5: Up (⬆) 0.7 million barrels to 49.6 million barrels
Cushing, Oklahoma, inventories were down (⬇) 1.1 million barrels to 26.4 million barrels.
Domestic crude oil production remained unchanged (=) at 13.3 million barrels per day.
Crude oil imports averaged 5.792 million barrels per day, a daily decrease (⬇) of 768,000 barrels. Exports increased (⬆) 85,000 barrels daily to 3.756 million barrels per day.
Refineries used 93.3% of capacity; the same (=) as the previous report week.
Crude oil inputs to refineries increased (⬆) 36,000 barrels daily; there were 16.900 million barrels per day of crude oil run to facilities. Gross inputs, which include blending stocks, decreased (⬇) 2,000 barrels daily to 17.099 million barrels daily.
Total petroleum product inventories decreased (⬇) by 1.1 million barrels from the previous report week, down to 851.9 million barrels.
Total product demand decreased (⬇) 1,051,000 barrels daily to 21.592 million barrels per day.
Gasoline stocks increased (⬆) 0.8 million barrels from the previous report week; total stocks are 219.2 million barrels.
Demand for gasoline decreased (⬇) 369,000 barrels per day to 8.938 million barrels per day.
Distillate fuel oil stocks decreased (⬇) 0.4 million barrels from the previous report week; distillate stocks are at 122.7 million barrels. EIA reported national distillate demand at 3.997 million barrels per day during the report week, an increase (⬆) of 175,000 barrels daily.
Propane stocks rose (⬆) 2.6 million barrels from the previous report to 95.7 million barrels. The report estimated current demand at 729,000 barrels per day, a decrease (⬇) of 298,000 barrels daily from the previous report week.
Natural Gas
Natural gas prices are holding above $2.00 per MMBtu, after declining to a low $1.856 with the expiration of the September contract. As Autumn begins, domestic storage levels remain above long-term averages despite a hotter than normal summer. Wall Street analysts also have their sights on natural gas producers as natural gas prices lag last year. Additional production cuts have been put in place for the remainder of 2024. Technically, the bulls need a settlement above $2.30 to signal a change in direction.
According to the EIA:
- Working gas in storage was 3,347 Bcf as of Friday, August 30, 2024, according to EIA estimates. This represents a net increase of 13 Bcf from the previous week. Stocks were 208 Bcf higher than last year at this time and 323 Bcf above the five-year average of 3,024 Bcf. At 3,347 Bcf, total working gas is within the five-year historical range.
Was this helpful? We’d like your feedback.
Please respond to [email protected]
This material has been prepared by a sales or trading employee or agent of Powerhouse Brokers, LLC and is, or is in the nature of, a solicitation. This material is not a research report prepared by Powerhouse Brokers, LLC. By accepting this communication, you agree that you are an experienced user of the futures markets, capable of making independent trading decisions, and agree that you are not, and will not, rely solely on this communication in making trading decisions.
DISTRIBUTION IN SOME JURISDICTIONS MAY BE PROHIBITED OR RESTRICTED BY LAW. PERSONS IN POSSESSION OF THIS COMMUNICATION INDIRECTLY SHOULD INFORM THEMSELVES ABOUT AND OBSERVE ANY SUCH PROHIBITION OR RESTRICTIONS. TO THE EXTENT THAT YOU HAVE RECEIVED THIS COMMUNICATION INDIRECTLY AND SOLICITATIONS ARE PROHIBITED IN YOUR JURISDICTION WITHOUT REGISTRATION, THE MARKET COMMENTARY IN THIS COMMUNICATION SHOULD NOT BE CONSIDERED A SOLICITATION.
The risk of loss in trading futures and/or options is substantial and each investor and/or trader must consider whether this is a suitable investment. Past performance, whether actual or indicated by simulated historical tests of strategies, is not indicative of future results. Trading advice is based on information taken from trades and statistical services and other sources that Powerhouse Brokers, LLC believes are reliable. We do not guarantee that such information is accurate or complete and it should not be relied upon as such. Trading advice reflects our good faith judgment at a specific time and is subject to change without notice. There is no guarantee that the advice we give will result in profitable trades.
Copyright 2024 Powerhouse Brokers, LLC, All rights reserved


