U.S. Petroleum Stocks Falter
- Demand for oil products fails at summer’s end
- Propane demand is a year-to-date exception
- U.S. K-jet demand still struggles
- Longer-term outlook challenged by non-hydrocarbon energy sources
- Natural gas markets are becoming global

The Matrix
Market watchers had expected that disappointing economics and the negative impact of CD-19 were fading as the summer advanced. This hope was dashed with the latest data from the Department of Energy.
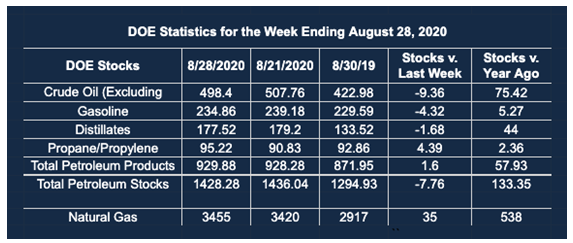
Data for the week ending August 28 showed lagging demand for all petroleum products on a week-on-week basis. It was the same when looking at demand year-to-date compared with last year, excepting propane. Propane demand stood at 1.1 million barrels daily on August 28, 4.4% higher than last year at this time.

Jet Fuel Supplied 1990 – 2020 Source: EIA
Jet fuel demand has been far and away the most severely damaged in this year’s economic debacle. Last year at this time, demand for jet fuel was running at 1.8 million barrels daily, supporting a robust economy. The most recent data put year to date demand at 1.1 million barrels per day, a drop of nearly 40%. Weekly demand fell to 352,000 daily barrels early in May.
Consumption of jet fuel has more than doubled since then but still faces serious challenges. Many offices have not reopened and travel by air is the exception.
Refinery utilization fell sharply according to the EIA data. National usage of refining was 76.7%, a reduction of 5.3% points. This was the result of Hurricane Laura, and had no significant impact on futures prices.
The availability of refinery capacity is another concern for the industry. As demand falters, refining will as well. Older European facilities in particular are candidates for scrap. Moreover, new refineries are planned for China and the Middle East.
Over the longer term, more demanding emission requirements and fuel efficiency standards will pressure refiners, as will competition from electric automobiles.
Supply/Demand Balances
Supply/demand data in the United States for the week ended Aug. 28, 2020, were released by the Energy Information Administration.
Total commercial stocks of petroleum fell by 7.8 million barrels during the week ended Aug. 28, 2020.
Commercial crude oil supplies in the United States decreased by 9.4 million barrels from the previous report week to 498.4 million barrels.
Crude oil inventory changes by PAD District:
PADD 1: Plus 0.5 million barrels to 12.0 million barrels
PADD 2: Minus 1.4 million barrels to 139.9 million barrels
PADD 3: Minus 8.0 million barrels to 268.7 million barrels
PADD 4: Minus 0.7 million barrels to 24.6 million barrels
PADD 5: Plus 0.3 million barrels to 53.2 million barrels
Cushing, Oklahoma inventories were up 0.1 million barrels from the previous report week to 52.5 million barrels.
Domestic crude oil production fell 1.1 million barrels per day from the previous report week to 9.7 million barrels daily.
Crude oil imports averaged 4.9 million barrels per day, a daily decrease of 1.0 million barrels. Exports of crude oil fell 361,000 barrels daily to 3.0 million barrels per day.
Refineries used 76.7% of capacity, down 5.3% points from the previous report week.
Crude oil inputs to refineries decreased 844,000 barrels daily; there were 13.868 million barrels per day of crude oil run to facilities.
Gross inputs, which include blending stocks, dropped 1.0 million barrels per day daily to reach 14.305 million barrels daily.
Total petroleum product inventories rose 1.7 million barrels from the previous report week. Total product demand decreased 2.640 million barrels daily to 19.619 million barrels per day.
Gasoline stocks decreased 4.3 million barrels daily from the previous report week; total stocks were 234.9 million barrels.
Demand for gasoline fell 374,000 barrels per day to 8.786 million barrels per day.
Distillate fuel oil stocks fell 1.7 million barrels from the previous report week; distillate stocks are at 177.5 million barrels.
EIA reported national distillate demand at 3.918 million barrels per day during the week, a decline of 40,000 barrels daily.
Propane stocks increased 4.4 million barrels from the previous report week; propane stocks are 95.2 million barrels. The report estimated current demand at 0.623 million barrels per day, a decline of 592,000 barrels daily from the previous report week.
Natural Gas
Natural gas supplies in the United States are expected to be at or near-record highs when the heating season begins in November. Futures prices have, nonetheless, behaved bullishly. This year’s low spot futures price was set June 26, at $1.432. Prices nearly doubled by August 28, when $2.743 was reached. At the Labor Day break, spot natural gas futures fell back to $2.588.
Shifting industry dynamics have focused attention on international markets as natural gas becomes a global commodity in which the United States exports LNG. Gas is generally sent to Asia. Its default destination is Europe. European stocks, however, are at high levels and could limit further price advances, especially if a warmer winter occurs.
According to the EIA:
The net injections [of natural gas] into storage totaled 35 Bcf for the week ending August 28, compared with the five-year (2015–19) average net injections of 66 Bcf and last year’s net injections of 77 Bcf during the same week. Working natural gas stocks totaled 3,455 Bcf, which is 407 Bcf more than the five-year average and 538 Bcf more than last year at this time.
The average rate of injections into storage is 7% higher than the five-year average so far in the refill season (April through October). If the rate of injections into storage matched the five-year average of 10.5 Bcf/d for the remainder of the refill season, the total inventory would be 4,130 Bcf on October 31, which is 407 Bcf higher than the five-year average of 3,723 Bcf for that time of year.
Was this helpful? We’d like your feedback.
Please respond to [email protected]
Powerhouse Futures & Trading Disclaimer
Copyright 2020 Powerhouse Brokerage, LLC, All rights reserved