Soft Oil Demand Worries Markets
- IEA sees “treacherous” oil price action
- Major oil company believes demand peaked in 2019
- OPEC leader threatens over-producers
- EIA expects natural gas storage to exceed four Tcf
Alan Levine, Chairman of Powerhouse
The Matrix
Market watchers typically look at supply fundamentals to assess the state of supply/demand balances and prices of oil and natural gas. Demand has traditionally been seen as a balancing factor with price as the primary mover.
Last week, that formulation did not hold up. Concerns about demand as the determining factor of market action moved forward decisively. There were many participants piling on.
- OPEC cautioned that risks to price should remain “remain elevated and skewed to the downside.”
- The International Energy Agency said price action would be “‘treacherous’ amid weakening sentiment and an upsurge in the number of coronavirus cases reported worldwide.”
- Private sector participants echoed similar sentiments. BP now expects that oil demand may have already peaked in 2019. Under three possible situations, the Company predicted falling demand through 2050.

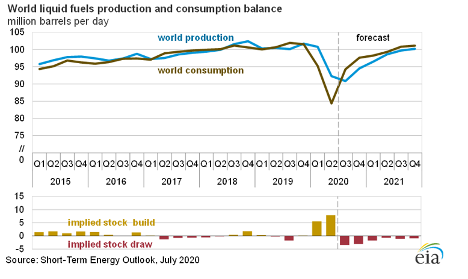
The bearish sentiment behind these expectations was based on the impact of the coronavirus on demand earlier this year when usage was gutted by the advance of Covid-19. At that time, restrictions on movements globally were reflected in fuel demand. Demand recovered in the summer. Most recently, however, there has been a resurgence in infections with attendant lockdowns and loss of demand.
OPEC+ reacted with a coordinated effort to reduce production. Its success has been moderate. The group has estimated overproduction of 2.38 million barrels per day from May through August.
OPEC’s leader adopted a particularly incendiary tone. Prince Abdulaziz bin Salman, OPEC’s most influential minister, was quoted as warning traders, “against betting heavily in the oil market saying he will try to make the market “jumpy” and promised those who gamble on the oil price would be hurt ‘like hell’.
“To those who want to short the oil market, Prince Abdulaziz had the following warning: “Make my day,” he said in an apparent reference to Hollywood star Clint Eastwood’s expression from the Dirty Harry neo-noir thriller.”
Supply/Demand Balances
Supply/demand data in the United States for the week ended Sept. 11, 2020, were released by the Energy Information Administration.
Total commercial stocks of petroleum rose by 4.3 million barrels during the week ended Sept. 11, 2020.
Commercial crude oil supplies in the United States decreased by 4.4 million barrels from the previous report week to 496.0 million barrels.
Crude oil inventory changes by PAD District:
- PADD 1: Fell 0.1 million barrels from to 12.1 million barrels
- PADD 2: Fell 0.6 million barrels to 140.5 million barrels
- PADD 3: Fell 2.8 million barrels to 266.6 million barrels
- PADD 4: Plus 0.4 million barrels to 23.8 million barrels
- PADD 5: Fell 1.3 million barrels to 53.1 million barrels
Cushing, Oklahoma inventories were down 0.1 million barrels from the previous report week to 54.3 million barrels.
Domestic crude oil production was rose 900,000 barrels per day from the previous report week to 10.9 million barrels daily.
Crude oil imports averaged 5.008 million barrels per day, a daily decrease of 413,000 barrels. Exports decreased 349,000 barrels daily to 2.595 million barrels per day.
Refineries used 75.8% of capacity, up 4.0% from the previous report week.
Crude oil inputs to refineries increased 1.291 million barrels daily; there were 13.488 million barrels per day of crude oil run to facilities. Gross inputs, which include blending stocks, rose 761,000 barrels daily to reach 14.123 million barrels daily.
Total petroleum product inventories rose 8.7 million barrels from the previous report week.
Gasoline stocks decreased 0.4 million barrels daily from the previous report week; total stocks are 231.5 million barrels.
Demand for gasoline rose 87,000 barrels per day to 8.478 million barrels per day.
Total product demand decreased 1.651 million barrels daily to 17.027 million barrels per day.
Distillate fuel oil stocks increased 3.5 million barrels from the previous report week; distillate stocks are at 179.3 million barrels. EIA reported national distillate demand at 2.809 million barrels per day during the report week, a decrease of 905,000 barrels daily.
Propane stocks decreased 1.2 million barrels from the previous report week; propane stocks are 96.1 million barrels. The report estimated current demand at 1.478 million barrels per day, an increase of 383,000 barrels daily from the previous report week.
Natural Gas
Natural gas in underground storage is hugging the five-year maximum line in the chart above. There is little doubt that the United States will be well-supplied this fall as markets turn to withdrawal. As noted below, EIA expects stocks to be well over four Tcf as October ends.
According to the EIA:
The net injections [of natural gas] into storage totaled 89 Bcf for the week ending September 11, compared with the five-year (2015–19) average net injections of 77 Bcf and last year’s net injections of 82 Bcf during the same week. Working natural gas stocks totaled 3,614 Bcf, which is 421 Bcf more than the five-year average and 535 Bcf more than last year at this time.
The average rate of injections into storage is 7% higher than the five-year average so far in the refill season (April through October). If the rate of injections into storage matched the five-year average of 10.6 Bcf/d for the remainder of the refill season, the total inventory would be 4,144 Bcf on October 31, which is 421 Bcf higher than the five-year average of 3,723 Bcf for that time of year.
Was this helpful? We’d like your feedback.
Please respond to [email protected]
Powerhouse Futures & Trading Disclaimer
Copyright 2020 Powerhouse Brokerage, LLC, All rights reserved
e


