Military Actions Cede the Spotlight to Economics
- Israel v. Iran retaliatory strikes may be paused
- Upcoming China policy meeting looms
- Important seasonal change coming for gasoline futures
- Short-covering rally fizzles, NG bears return
Sincerely,
David Thompson, CMT
Executive Vice President
Powerhouse
(202) 333-5380
The Matrix
The energy markets are interpreting Israel’s most recent strike against Iranian military targets as the completion of this round of reprisals. The U.S. had lobbied Israel to avoid striking oil or nuclear infrastructure. The reported strikes against Iranian missile manufacturing sites serves dual purposes of limiting Iran’s ability to launch futures waves of missiles at Israel or export these weapons to Russia for use in Ukraine. Petroleum markets gapped down to start the trading week and continue to be ruled by bearish sentiment.
With the threat of significant interruption of Iranian oil exports receding, the state of the Chinese economy returns to the forefront. In late September, Chinese authorities unleashed several monetary support measures and while this had a positive effect on the Chinese stock market, it has not translated into the hoped for gains in real GDP growth. Third quarter Chinese GDP grew at an annual rate of 4.6%, well below the “about 5%” growth targeted by the Chinese officials. As a result, China’s top legislative body, the Standing Committee of the National People’s Congress has scheduled a meeting for November 4-8th to consider a new fiscal support package. The dates of the meeting were changed from late October likely in consideration of the U.S. presidential election.
While perhaps not as momentous as the first week in November in terms of market moving news, the first week in December is also fast approaching and has its own importance for energy markets. NYMEX RBOB futures covering the spring months tend to find a seasonal bottom in early December. Gasoline retailers should target this window to consider deploying hedges to protect against the squeeze of their gross profits during late Q1 and Q2. If you would like to delve deeper into these strategies, please contact us in the next few weeks.
Supply/Demand Balances
Supply/demand data in the United States for the week ended October 18, 2024, were released by the Energy Information Administration.
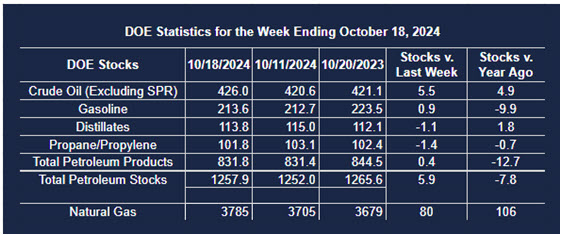
Total commercial stocks of petroleum increased (⬆) 5.9 million barrels to 1.257.9 billion barrels during the week ended October 18th, 2024.
Commercial crude oil supplies in the United States were higher (⬆) by 5.5 million barrels from the previous report week to 426.0 million barrels.
Crude oil inventory changes by PAD District:
PADD 1: Down (⬇) 0.2 million barrels to 8.1 million barrels
PADD 2: Down (⬇) 0.9 million barrels to 104.3 million barrels
PADD 3: Up (⬆) 4.4 million barrels to 244.3 million barrels
PADD 4: Unchanged (=) at 22.1 million barrels
PADD 5: Up (⬆) 2.3 million barrels to 47.3 million barrels
Cushing, Oklahoma, inventories were down (⬇) 0.3 million barrels to 24.7 million barrels.
Domestic crude oil production remained unchanged (=) from the previous report at 13.5 million barrels per day.
Crude oil imports averaged 6.431 million barrels per day, a daily increase (⬆) of 902,000 barrels. Exports decreased (⬇) 11,000 barrels daily to 4.112 million barrels per day.
Refineries used 89.5% of capacity; an increase (⬆) of 1.7% from the previous report week.
Crude oil inputs to refineries increased (⬆) 329,000 barrels daily; there were 16.084 million barrels per day of crude oil run to facilities. Gross inputs, which include blending stocks, increased (⬆) 328,000 barrels daily to 16.395 million barrels daily.
Total petroleum product inventories increased (⬆) by 0.4 million barrels from the previous report week, down to 831.9 million barrels.
Total product demand decreased (⬇) 446,000 barrels daily to 20.251 million barrels per day.
Gasoline stocks increased (⬆) 0.9 million barrels from the previous report week; total stocks are 213.6 million barrels.
Demand for gasoline increased (⬆) 218,000 barrels per day to 8.838 million barrels per day.
Distillate fuel oil stocks decreased (⬇) 1.1 million barrels from the previous report week; distillate stocks are at 113.8 million barrels. EIA reported national distillate demand at 4.131 million barrels per day during the report week, a decrease (⬇) of 81,000 barrels daily.
Propane stocks fell (⬇) 1.4 million barrels from the previous report to 101.8 million barrels. The report estimated current demand at 1,089,000 barrels per day, an increase (⬆) of 305,000 barrels daily from the previous report week.
Natural Gas
The brief surge in natural gas futures prices that occurred last week met the classic hallmarks of a short-covering rally. During the up move, total market open interest fell. And when the market was hit with above-normal temperature forecasts to start this week, the heavy sell-off was accompanied by the return of increasing open interest. With the transition to the December contract as front-month, the support level moves up to $2.71/MMBtu.
From the EIA Natural Gas Weekly Update,
- Net injections into storage totaled 80 Bcf for the week ended October 18, compared with the five-year (2019–2023) average net injections of 76 Bcf and last year’s net injections of 81 Bcf during the same week. Working natural gas stocks totaled 3,785 Bcf, which is 167 Bcf (5%) more than the five-year average and 106 Bcf (3%) more than last year at this time.
- According to The Desk survey of natural gas analysts, estimates of the weekly net change to working natural gas stocks ranged from net injections of 43 Bcf to 73 Bcf, with a median estimate of 66 Bcf.
- The average rate of injections into storage is 23% lower than the five-year average so far in the refill season (April through October). If the rate of injections into storage matched the five-year average of 7.3 Bcf/d for the remainder of the refill season, the total inventory would be 3,879 Bcf on October 31, which is 167 Bcf higher than the five-year average of 3,712 Bcf for that time of year.
Was this helpful? We’d like your feedback.
Please respond to [email protected]
This material has been prepared by a sales or trading employee or agent of Powerhouse Brokers, LLC and is, or is in the nature of, a solicitation. This material is not a research report prepared by Powerhouse Brokers, LLC. By accepting this communication, you agree that you are an experienced user of the futures markets, capable of making independent trading decisions, and agree that you are not, and will not, rely solely on this communication in making trading decisions.
DISTRIBUTION IN SOME JURISDICTIONS MAY BE PROHIBITED OR RESTRICTED BY LAW. PERSONS IN POSSESSION OF THIS COMMUNICATION INDIRECTLY SHOULD INFORM THEMSELVES ABOUT AND OBSERVE ANY SUCH PROHIBITION OR RESTRICTIONS. TO THE EXTENT THAT YOU HAVE RECEIVED THIS COMMUNICATION INDIRECTLY AND SOLICITATIONS ARE PROHIBITED IN YOUR JURISDICTION WITHOUT REGISTRATION, THE MARKET COMMENTARY IN THIS COMMUNICATION SHOULD NOT BE CONSIDERED A SOLICITATION.
The risk of loss in trading futures and/or options is substantial and each investor and/or trader must consider whether this is a suitable investment. Past performance, whether actual or indicated by simulated historical tests of strategies, is not indicative of future results. Trading advice is based on information taken from trades and statistical services and other sources that Powerhouse Brokers, LLC believes are reliable. We do not guarantee that such information is accurate or complete and it should not be relied upon as such. Trading advice reflects our good faith judgment at a specific time and is subject to change without notice. There is no guarantee that the advice we give will result in profitable trades.
Copyright 2024 Powerhouse Brokers, LLC, All rights reserved